
WT - Tick Imbalance Bars
指标
2 购买
版本 2.0, Nov 2025
Windows 版、Mac 版
5.0
评价:1
说明
TIB — 交易不平衡条指标。在价格变动前检测市场信息
版本 2.0
使用评论区询问更多细节
购买后可提供带设置指南的视频课程
交易不平衡条为cTrader带来机构级市场微观结构分析。基于Marcos López de Prado开创性的研究,详见其著作 金融机器学习的进展,该指标不是按时间或成交量采样价格数据,而是按信息到达进行采样。
核心见解
传统的条形图(时间、成交笔数、成交量)均匀采样市场,错过了有信息交易者行动的关键时刻。交易不平衡条通过检测买卖压力何时超过预期水平来解决这一问题——这表明有信息交易者的存在以及市场达到均衡前的潜在价格变动。
工作原理
该指标应用成交笔规则,将每笔交易分类为买入压力(+1)或卖出压力(-1)。然后累计这些带符号的成交笔数,直到累计不平衡(θT)超过使用指数加权移动平均(EWMA)计算的动态阈值。该预期阈值通过分析买卖成交笔的历史概率适应市场状况。当阈值被突破时,生成一个新的TIB条——每条包含大致相等量的市场信息,无论成交量或经过时间如何。
主要特征
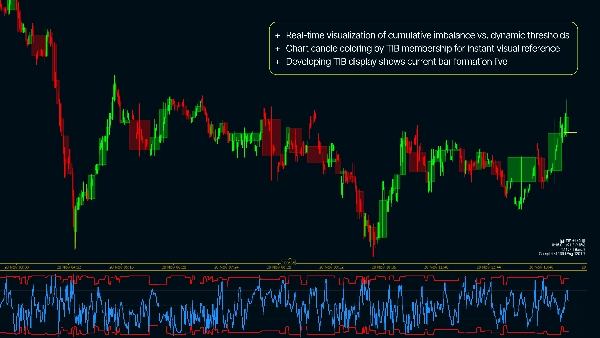
- 实时可视化累计不平衡与动态阈值的对比
- 通过TIB归属为图表蜡烛着色,便于即时视觉参考
- 开发中的TIB显示当前条形的实时形成
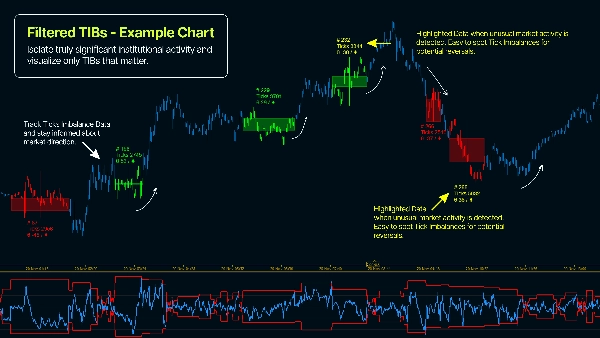
- 最小成交笔过滤器,仅显示统计显著的条形
- 完全可配置的预期条形大小和EWMA参数
- 仪表盘指标跟踪不平衡强度和信息密度
为何使用交易不平衡条?
- 在高信息期更频繁采样——捕捉可操作的波动性
- 在价格达到均衡前检测有信息的交易活动
- 减少无信息市场参与者和散户订单流的噪音
- 比基于时间的采样实现更好的统计特性(独立同分布的高斯类收益)
- 应用机构交易者使用的经过验证的量化金融方法
- 识别订单流中的非对称信息——价格方向的有效预测指标
基础配置实用设置指南(!)
- 在1分钟时间框架上应用指标(或更低——使用基于成交笔的图表)
- E[T] - 输入每条条形的预期成交笔数采样(从1000开始)
- EWMA Alpha - [0.001 - 0.5],其中0.001理论上产生最稳定的结果,0.5则基于更近期数据生成TIB
- 初始不平衡 - 推荐0.5,但可自行尝试(0.5 = 初始化时净不平衡)
摘要
AI 摘要
WT - Tick Imbalance Bars is an indicator for cTrader that applies institutional-grade market microstructure analysis based on the research of Marcos López de Prado. Unlike traditional bars that sample price data by time or volume, this indicator samples based on information arrival, detecting buying or selling pressure imbalances that signal informed trading activity before price equilibrium is reached.
The indicator classifies each trade as buying (+1) or selling (-1) pressure using the tick rule and accumulates these signed ticks until a dynamic threshold—calculated via an Exponentially Weighted Moving Average (EWMA)—is exceeded. When this threshold is breached, a new Tick Imbalance Bar (TIB) is formed, each containing roughly equal market information regardless of elapsed time or volume.
Key features include real-time visualization of cumulative imbalance versus dynamic thresholds, candle coloring by TIB membership, live display of the developing bar, a minimum ticks filter for statistical significance, configurable expected bar size and EWMA parameters, and dashboard metrics tracking imbalance intensity and information density.
This approach enables more frequent sampling during high-information periods, reduces noise from uninformed trades, and provides better statistical properties than time-based sampling. It supports markets including Forex, indices, and cryptocurrencies, and is suitable for strategies such as scalping and breakout trading.
指标配置
客户评价
5.0
评价:1
5 | 100 % | |
4 | 0 % | |
3 | 0 % | |
2 | 0 % | |
1 | 0 % |
客户评价
November 30, 2025
WT - Tick Imbalance Bars paints a clean picture of supply/demand imbalances on tick-by-tick data. Great for scalpers and order-flow traders who want to see where traders are stepping in hard. Bars highlight strong imbalances instantly. On higher timeframes it loses noise advantage - best as a micro-timeframe tool. Alerts and stats would make it even stronger.
讨论
常见问答
Prop
Forex
Signal
Breakout
Scalping
Indices
Crypto
cTrader Store 提供的所有产品,包括交易机器人、指标和插件,均由第三方开发者提供,仅供信息参考和技术访问之用。cTrader Store 并非经纪商,不提供投资建议、个人推荐或任何未来业绩保证。
该作者的其他作品


!["Wyckoff Toolkit [Iridio Capital]" 标识](https://cdn.ctrader.com/image/webp/8acfe6a1-6a8e-4578-9367-9df3af2b1801_27763)


价格
88.59M
交易量
105.61K
盈利点数
75
销售
457
免费安装