
Description
🚀 ICT Order Block Advanced - Indicateur de trading professionnel
Maîtrisez les concepts ICT avec le système d'Order Block le plus complet disponible
ICT Order Block Advanced est l'outil ultime pour les traders suivant la méthodologie ICT (Inner Circle Trader). Ce n'est pas seulement un indicateur d'order block - c'est un système de trading institutionnel complet qui identifie les Order Blocks, les Fair Value Gaps, les zones de liquidité, les Breaker Blocks et la structure du marché, le tout dans un seul package puissant.
💎 Pourquoi c'est l'indicateur d'Order Block le plus avancé
Cet indicateur combine CINQ concepts ICT critiques en un système fluide :
✅ Order Blocks (OBs) - Où les institutions passent leurs ordres
✅ Fair Value Gaps (FVGs) - Déséquilibres que les institutions doivent combler
✅ Zones de liquidité - Où les stops s'accumulent (objectifs de balayage)
✅ Breaker Blocks - OBs échoués qui deviennent des zones de retournement
✅ Structure du marché - Identification HH, HL, LH, LL avec BOS/CHoCH
C'est la méthodologie ICT dans sa forme la plus pure et la plus exploitable.
✨ Caractéristiques clés qui distinguent cet outil
🎯 Détection intelligente des Order Blocks
- Identifie automatiquement les order blocks institutionnels
- Affiche les 6 derniers blocs les plus récents (personnalisable de 1 à 15)
- Codé par couleur selon la direction (Vert = haussier, Rouge = baissier)
- Suppression automatique lorsqu'ils sont atténués
📊 Système de notation de qualité (A+ à C)
- Note chaque Order Block selon sa qualité (A+, A, B, C)
- Prend en compte le volume, la taille, la structure et la confluence
- Note plus élevée = trade à probabilité plus élevée
- La transparence visuelle montre instantanément la qualité
🎨 Détection des Fair Value Gaps (FVG)
- Identifie les déséquilibres haussiers et baissiers
- Couleurs personnalisables (zones vertes/rouges)
- Suppression automatique lorsqu'ils sont comblés
- Montre où le prix reviendra probablement
💰 Cartographie des zones de liquidité
- Marque les plus hauts/bas récents (bassins de liquidité)
- Montre où les institutions balayeront les stops
- Épaisseur de ligne = force de la liquidité
- Parfait pour les trades de capture de liquidité
🔄 Identification des Breaker Blocks
- Détecte quand les Order Blocks échouent et se retournent
- Ancien support devient résistance (et vice versa)
- Montre les zones pièges institutionnelles
- Arme secrète des traders avancés
📈 Structure complète du marché
- Marque HH (Higher High), HL (Higher Low)
- Marque LH (Lower High), LL (Lower Low)
- Trace automatiquement les lignes de tendance
- Identifie BOS (Break of Structure) et CHoCH (Change of Character)
⚡ Filtre de volatilité
- Filtre optionnel basé sur l'ATR
- Affiche les OB uniquement en période de forte volatilité
- Filtre les blocs faibles/de faible qualité
- Se concentre uniquement sur les configurations de qualité institutionnelle
🎯 Comment les traders ICT professionnels utilisent cet outil
Stratégie 1 : Entrée sur Order Block de haute qualité
La configuration : Le marché crée un Order Block, l'indicateur le note "A+" ou "A"
Le trade :
- Attendez que le prix revienne dans la zone OB
- Entrez lorsque le prix touche l'OB (affiché en rectangle vert/rouge)
- Stop loss : Au-delà de l'OB
- Objectif : Prochaine zone de liquidité ou OB opposé
Pourquoi ça marche : Les blocs notés A+ ont le plus grand intérêt institutionnel - volume, structure et confluence s'alignent. Ce sont les blocs que les institutions défendront.
Stratégie 2 : Confluence Fair Value Gap + Order Block
La configuration parfaite :
- Formation d'un Order Block (rectangle vert)
- Apparition d'un Fair Value Gap au même niveau (zone vert clair)
- Le prix revient vers cette zone de confluence
L'entrée : Entrez LONG lorsque les deux zones s'alignent. Double intérêt institutionnel = double probabilité.
Pourquoi c'est puissant : Les institutions ont laissé DEUX types d'inefficacités au même prix - elles REVIENDRONT ici.
Stratégie 3 : Balayage de liquidité dans l'Order Block
Le classique ICT :
- Identifier la zone de liquidité (ligne pointillée au plus bas récent)
- Le prix balaie en dessous (prend les stops des particuliers)
- Le prix rebondit immédiatement dans l'Order Block haussier
- ENTRER LONG - les institutions viennent de saisir la liquidité et achètent maintenant
Pourquoi c'est de l'or : C'est ainsi que les institutions opèrent : elles balaient la liquidité (stops des particuliers), puis poussent le prix dans l'autre sens. Vous attrapez le retournement.
Stratégie 4 : Renversement Breaker Block
La configuration :
- Order Block haussier atténué (cassé)
- L'indicateur le montre comme Breaker Block (ligne pointillée vert foncé)
- Le prix revient le tester par le dessus
Le trade : SHORT lorsque le prix touche le Breaker Block par le dessus. Ce qui était support est maintenant résistance.
Pourquoi ça marche : Les institutions n'ont pas réussi à maintenir ce niveau - elles le défendent maintenant de l'autre côté.
Stratégie 5 : Confirmation de la structure du marché
Utilisation de HH, HL, LH, LL :
- Le marché montre HL (Higher Low) + HH (Higher High) = structure haussière
- Order Block se forme au HL
- Biais LONG uniquement - la structure confirme la direction
BOS vs CHoCH :
- BOS (Break of Structure) = continuation de tendance
- CHoCH (Change of Character) = renversement de tendance
- Ne trader que les OB alignés avec la structure actuelle
🔥 Ce qui différencie cet outil des indicateurs d'Order Block basiques
Les indicateurs OB basiques montrent uniquement les order blocks, sans notation de qualité, sans Fair Value Gaps, sans zones de liquidité, sans breaker blocks, sans structure de marché, et traitent tous les OB de manière égale.
ICT Order Block Advanced montre le système ICT complet (5 concepts), note la qualité des OB (de A+ à C), identifie automatiquement les Fair Value Gaps, cartographie les zones de liquidité, détecte les breaker blocks, marque la structure complète du marché (HH/HL/LH/LL), dispose d'un filtrage de volatilité, et affiche les zones de confluence.
C'est la différence entre un outil et un système de trading complet.
🎓 Qui a besoin de cet indicateur ?
✅ Étudiants ICT - Apprenez et appliquez correctement les concepts ICT
✅ Traders Order Block - Obtenez des OB notés avec confluence
✅ Traders Smart Money - Voyez toutes les empreintes institutionnelles
✅ Traders Liquidité - Identifiez les opportunités de balayage
✅ Traders Structure - Marquage automatisé HH/HL/LH/LL
✅ Traders sérieux - Système complet, pas seulement un concept
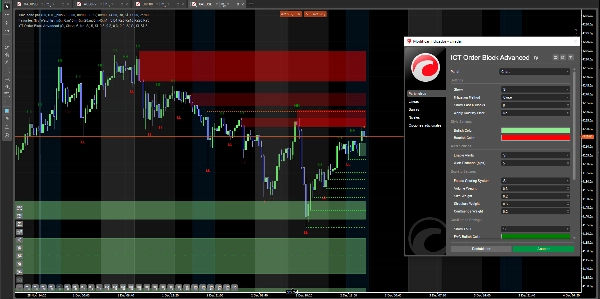
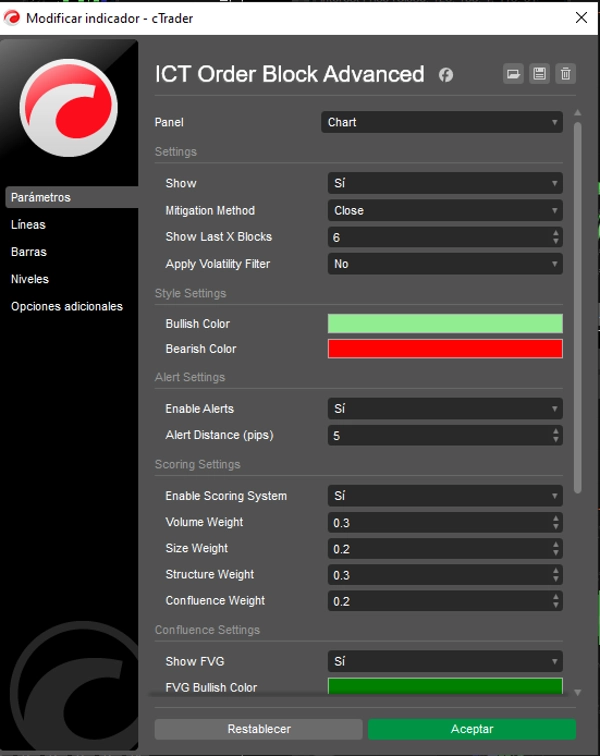
⚙️ Entièrement personnalisable
Paramètres des Order Blocks :
- Afficher les X derniers blocs (1-15, 6 par défaut)
- Méthode d'atténuation (Clôture ou Mèche)
- Filtre de volatilité activé/désactivé
- Couleurs personnalisées (Haussier/Baissier)
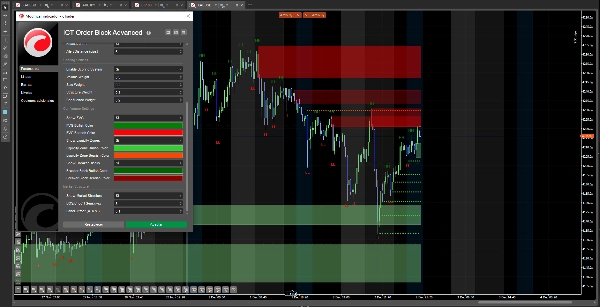
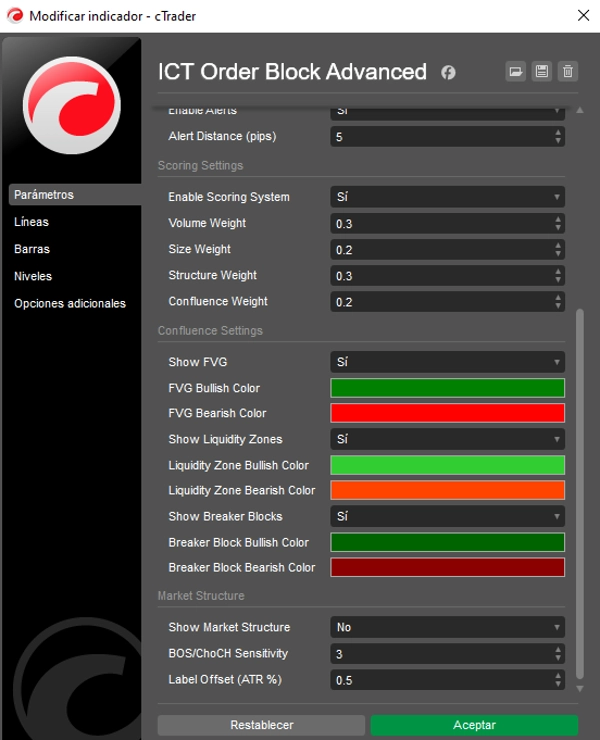
Système de notation de qualité :
- Activer/désactiver la notation
- Ajuster les poids : Volume, Taille, Structure, Confluence
- Transparence personnalisée selon la qualité
Fonctionnalités de confluence :
- Afficher/masquer les Fair Value Gaps (couleurs personnalisées)
- Afficher/masquer les zones de liquidité (couleurs personnalisées)
- Afficher/masquer les Breaker Blocks (couleurs personnalisées)
Structure du marché :
- Afficher/masquer les marqueurs HH/HL/LH/LL
- Sensibilité BOS/CHoCH (1-10)
- Ajustement du décalage des étiquettes
- Trace automatique des lignes de tendance
🛡️ Gestion des risques intégrée
Placement du stop loss :
- Juste au-delà de la limite de l'Order Block
- En dessous/au-dessus du Breaker Block
- En dehors du Fair Value Gap
Confirmation d'entrée :
- Attendre les blocs notés A ou A+
- Chercher la confluence (OB + FVG + Liquidité)
- Confirmer avec la structure du marché (HH/HL pour les longs)
Dimensionnement des positions :
- Plus grand sur les blocs A+ avec confluence
- Moyen sur les blocs notés A
- Plus petit sur les blocs B/C ou configurations isolées
Objectifs de profit :
- Prochaine zone de liquidité
- Order Block opposé
- Fair Value Gap de l'autre côté
- Niveaux de structure du marché (HH/LL)
🚀 Le système ICT complet dont vous avez besoin
Cet indicateur répond à toutes les questions des traders ICT :
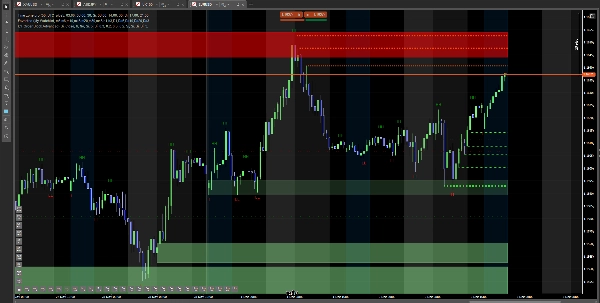
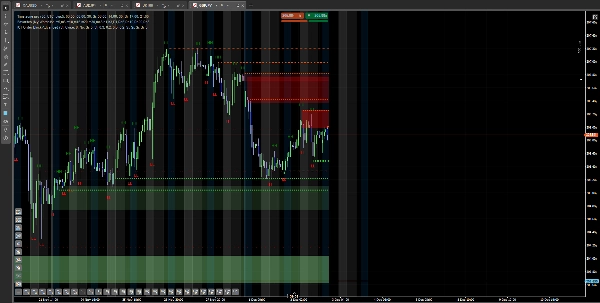
✅ Où sont les Order Blocks ? (Rectangles verts/rouges avec notes)
✅ Quels OB sont de la plus haute qualité ? (Notes A+, A, B, C)
✅ Où sont les Fair Value Gaps ? (Zones vert clair/rouge clair)
✅ Où est la liquidité ? (Lignes pointillées aux plus hauts/bas)
✅ Y a-t-il des Breaker Blocks actifs ? (Lignes pointillées plus foncées)
✅ Quelle est la structure du marché ? (Marqueurs HH, HL, LH, LL)
✅ Est-ce un BOS ou un CHoCH ? (Les lignes de tendance montrent les ruptures de structure)
Arrêtez de combiner plusieurs indicateurs. Obtenez le système ICT complet.
📈 Fonctionne sur tous les marchés et toutes les périodes
- Forex - Toutes les paires (marché principal d'ICT)
- Indices - NAS100, US30, UK100, SPX500, GER40
- Matières premières - Or, Argent, Pétrole
- Cryptomonnaies - Bitcoin, Ethereum
- Périodes - 1min à Daily (5min-1H optimal pour ICT)
Note : Les concepts ICT fonctionnent mieux sur des marchés liquides avec participation institutionnelle.
🎁 Maîtrisez le trading ICT aujourd'hui
Arrêtez de lutter avec des systèmes partiels. Obtenez la méthodologie ICT complète dans un seul indicateur.
Voyez les Order Blocks. Notez la qualité. Trouvez la confluence. Tradez la structure. Suivez la liquidité.
Compatible avec cTrader. Achat unique, mises à jour à vie.
Résumé
Key features include automatic detection and color-coded display of recent order blocks with a quality grading system (A+ to C) based on volume, size, structure, and confluence. It identifies bullish and bearish Fair Value Gaps and liquidity pools, maps breaker blocks for reversal zones, and marks market structure with trend lines. An optional ATR-based volatility filter highlights high-probability setups.
The indicator supports multiple markets including Forex, indices, commodities, cryptocurrencies, and stocks, and works across timeframes from 1 minute to daily (optimal 5 minutes to 1 hour). It offers customizable settings for block display, scoring weights, colors, and structure sensitivity.
ICT Order Block Advanced also provides built-in risk management guidance with stop loss placement beyond order blocks or breaker blocks, entry confirmation through confluence and market structure, and position sizing recommendations based on block quality. This tool consolidates ICT concepts into a unified system for institutional-level market analysis.


