

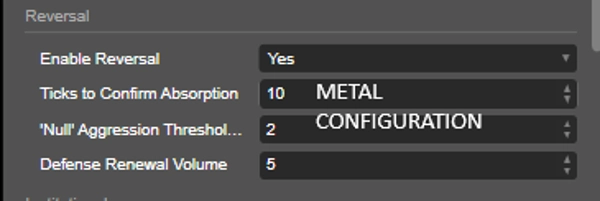
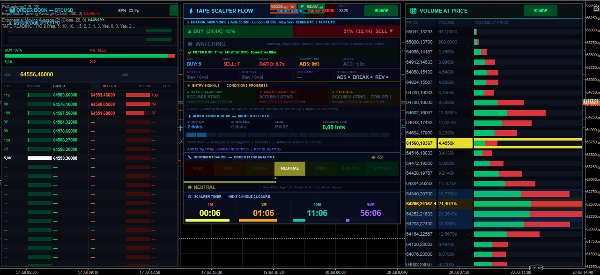

Description
🌐 DOMINEZ LE MARCHÉ AVEC LA LECTURE DU FLUX INSTITUTIONNEL
Ce que cela montre : les transactions réellement exécutées — le véritable flux d'agression.
Avantages : Cet indicateur est représenté par des données tick.
Représente l'argent déjà engagé sur le marché.
Classe les agresseurs (l'acheteur/vendeur frappe l'offre/la demande).
Détecte l'absorption, l'épuisement, l'accélération du flux.
📈Combinez avec les indicateurs gratuits, volume au prix, compresseur de volume.
https://ctrader.com/products/2514 https://ctrader.com/products/2874
Flux d'Ordres
Lecture du Ruban
Échelle DOM
Absorption Institutionnelle
Cassures Intelligentes
Inversions de Flux
Pression d'Achat et de Vente
Analyse d'Agression en Temps Réel
Le système transforme le graphique traditionnel en un véritable centre de lecture du marché institutionnel.
DIFFÉRENTIEL DE L'ALGORITHME
Alors que les indicateurs classiques n'analysent que les chandeliers, Tape Reading Scalper interprète :
✅ Agression réelle des acheteurs et vendeurs
✅ Vitesse du flux
✅ Défense institutionnelle
✅ Absorption des ordres
✅ Accélération de l'échelle
✅ Cassures confirmées par le flux
✅ Inversions par épuisement
✅ Pression institutionnelle vs. détail
✅ Échelonnement intelligent des lots
STRUCTURE DU SYSTÈME
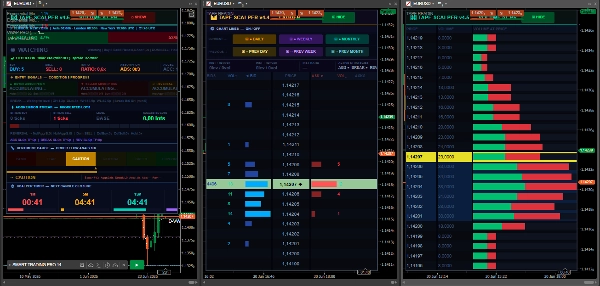
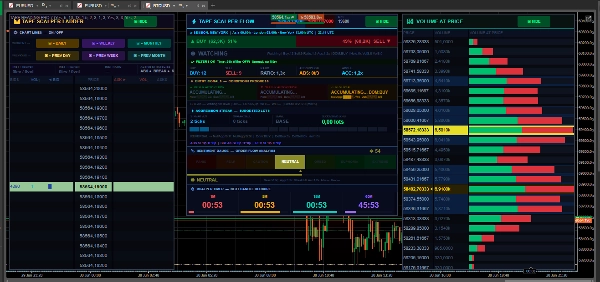
L'algorithme dispose de 2 panneaux professionnels indépendants :
⚡ PANNEAU DE FLUX (FENÊTRE 1)
Panneau responsable de la lecture opérationnelle et de la génération de signaux.
Affiche :
Flux Acheteur/Vendeur
Absorption
Inversion
Cassure
Série d'Agression
Sessions de Marché
Ratio Achat/Vente
Accélération de l'Échelle
SL/TP Dynamique
Filtres Opérationnels
📊 PANNEAU D'ÉCHELLE (FENÊTRE 2)
Panneau institutionnel axé sur :
Échelle DOM
Niveaux Institutionnels
Volume par Prix
Pression Institutionnelle
POC
Plage
Haut/Bas Quotidien et Hebdomadaire
Livre des Prix
Chaleur Institutionnelle
EXPLICATION DES FONCTIONS DE L'ÉCHELLE
1. AGRESSION D'ACHAT
Montre l'agression actuelle des acheteurs.
Lorsqu'elle augmente rapidement :
Les acheteurs entrent fortement. Le marché peut accélérer à la hausse. Indique une possible cassure.
Plus le chiffre est élevé :
➡ pression d'achat plus forte.
2. AGRESSION DE VENTE
Montre l'agression des vendeurs.
Lorsqu'elle croît rapidement :
Vendeurs dominants
Possible poursuite de la chute
Entrée short institutionnelle
3. RATIO ACHAT/VENTE
Montre la relation entre acheteurs et vendeurs.
Exemple :
Ratio 2.0x = les acheteurs dominent
Ratio 3.0x = forte pression institutionnelle
Ratio inférieur à 1.0 = vendeurs dominants
Interprétation :
Interprétation du Ratio
1.0 Équilibre
1.5 Pression modérée
2.0+ Tendance forte
3.0+ Flux institutionnel fort
4. ABSORPTION
Une des fonctions les plus puissantes de l'algorithme.
Le système détecte quand :
Il y a un volume agressif important
Mais le prix NE BOUGE PAS
Cela signifie :
➡ Les investisseurs institutionnels absorbent les ordres.
ABSORPTION ACHETEUR
Le marché reçoit beaucoup de ventes, mais :
Le prix cesse de baisser. Une défense institutionnelle apparaît. Possible inversion vers l'achat.
Signal :
▲ ABSORPTION ACHETEUR
ABSORPTION VENDEUR
Le marché reçoit beaucoup d'achats, mais :
Le prix ne monte pas. Les vendeurs freinent le mouvement. Possible inversion vers la vente.
Signal :
▼ ABSORPTION VENDEUR
5. ACCÉLÉRATION DE L'ÉCHELLE
Mesure la vitesse du flux dans le DOM.
L'algorithme compare :
Flux récent
vs. Flux précédent
Lorsqu'il s'accélère :
➡ Entrée institutionnelle probable.
Exemple :
Valeur Signification
1.0x Flux normal
1.5x Forte accélération
2.0x+ Explosion institutionnelle
6. DÉTECTION DE CASSURE
Détecte les vraies cassures.
Le système valide :
✅ Volume
✅ Agression
✅ Vitesse
✅ Série
✅ Flux Institutionnel
✅ Accélération de l'Échelle
CASSURE D'ACHAT
Conditions :
Forte agression d'achat Échelle en accélération Pression institutionnelle Cassure du plus haut
Résultat :
➡ Entrée d'achat validée.
CASSURE DE VENTE
Conditions :
Forte pression de vente Flux institutionnel vendeur Cassure du support
Résultat :
➡ Vente confirmée.
7. DÉTECTION D'INVERSION
Détecte les inversions dues à l'épuisement.
Le système identifie :
Disparition de l'agression Apparition de la défense institutionnelle Perte de force de la tendance
Résultat :
➡ Inversion anticipée.
8. SYSTÈME DE SÉRIES
Système intelligent de continuité du flux.
Compte combien de ticks consécutifs se sont produits :
Achat continu
ou
Vente continue
NIVEAUX DE SÉRIE
Niveau Signification
Niveau 1 Tendance Initiale
Niveau 2 Flux Fort
Niveau 3 Mouvement Explosif
9. LOTS SUGGÉRÉS
L'algorithme suggère automatiquement :
augmentation de la taille des lots
réduction du risque
échelle opérationnelle
Basé sur :
✅ Force du Flux
✅ Continuité
✅ Intensité Institutionnelle
11. POC (POINT DE CONTRÔLE)
Montre le prix avec le volume de trading le plus élevé.
Importance :
Support/résistance fort
Zone institutionnelle
Région de défense
12. NIVEAUX QUOTIDIENS/HEBDOMADAIRES
Lignes automatiques pour :
Haut quotidien
Bas quotidien
Haut hebdomadaire
Bas hebdomadaire
Utilisé pour :
✅ Cassures
✅ Inversions
✅ Liquidité
✅ Ordres stop-loss
13. FILTRE INSTITUTIONNEL
Filtre institutionnel avancé.
Différence :
Flux de détail
vs Flux institutionnel
Le système valide :
✅ Clusters institutionnels
✅ Volume par Niveau
✅ Pression dominante
📈Utilisez cet indicateur comme confirmation pour l'entrée dans votre stratégie. Il est important de souligner l'importance d'analyser le flux, les signaux d'absorption, la vitesse du ruban et l'agression en ticks, ainsi que le sentiment.
Résumé
Key functionalities include detection of institutional absorption (when large volume does not move price), breakout validation through volume and flow speed, reversal anticipation by exhaustion signals, and an intelligent streak system counting consecutive buy or sell ticks. The indicator also suggests lot sizing based on flow strength and institutional intensity, and applies an institutional filter distinguishing retail versus institutional flow.
Tape Reading 4.2 supports analysis of key market levels, real-time aggression, and flow reversals, transforming traditional charts into comprehensive institutional market reading tools. It is suitable for traders seeking detailed order flow insights and confirmation signals for entries based on market microstructure and volume dynamics.
Discussion
Avis clients
5 | 50 % | |
4 | 50 % | |
3 | 0 % | |
2 | 0 % | |
1 | 0 % |

Questions fréquentes




















![Logo de "[Hamster-Coder] Pivot Points MTF"](https://cdn.ctrader.com/image/webp/4c143e5a-309c-40e3-a578-f04d1e133ffa_31159)




Prix