Descripción
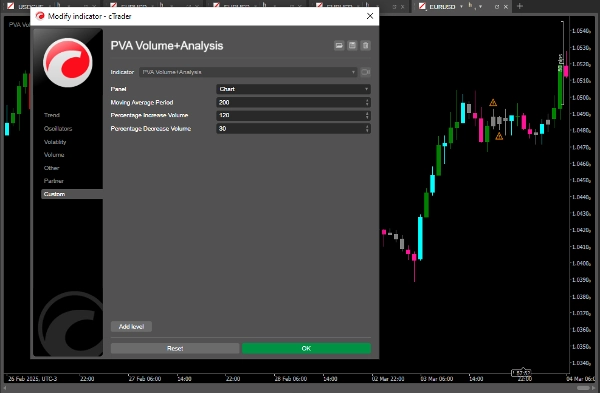
PVA (Análisis Precio-Volumen) es un enfoque de análisis técnico que estudia la relación entre el precio y el volumen de negociación de un activo financiero. La idea principal detrás del PVA es que el volumen de negociación puede proporcionar información importante sobre la fuerza y la dirección de una tendencia, ayudando a los traders a tomar decisiones más informadas.
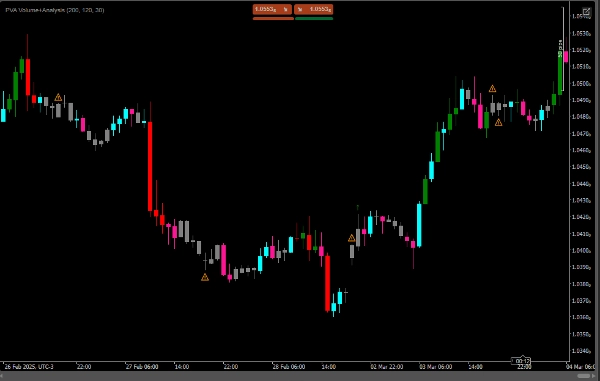
-Volumen creciente con precio en aumento: Indica una fuerte tendencia alcista, y se muestra un símbolo verde (flecha hacia arriba).
-Volumen creciente con precio en descenso: Indica una fuerte tendencia bajista, y se muestra un símbolo rojo (flecha hacia abajo).
-Volumen decreciente con precio en aumento: Indica que la tendencia alcista puede estar perdiendo fuerza, y se muestra una alerta naranja (símbolo de advertencia).
-Volumen decreciente con precio en descenso: Indica que la tendencia bajista puede estar perdiendo fuerza, y también se muestra una alerta naranja (símbolo de advertencia).
-Si el volumen está cayendo en un movimiento ascendente o descendente, se dibuja una marca de alerta (⚠️).
Resumen
- A green up arrow appears when volume increases alongside rising prices, indicating a strong uptrend.
- A red down arrow signals a strong downtrend when volume increases as prices fall.
- An orange warning symbol alerts when volume decreases during rising or falling prices, suggesting the current trend may be weakening.
- A general alert mark (⚠️) is displayed if volume declines during either upward or downward price movements.
This indicator assists traders by highlighting the interplay between price and volume, offering insights into the momentum behind market trends. It is designed for use in technical analysis to support more informed trading decisions.
Valoraciones de clientes
5 | 100 % | |
4 | 0 % | |
3 | 0 % | |
2 | 0 % | |
1 | 0 % |