
Descripción
El indicador MAGIC BLOCK STRATEGY combina dos enfoques principales para el análisis del mercado:
Detección de Bloques de Orden:
Identifica áreas de soporte y resistencia basadas en máximos y mínimos no superados dentro de un período de retroceso.
Genera señales de compra cuando el precio cierra por encima de un mínimo no superado.
Genera señales de venta cuando el precio cierra por debajo de un máximo no superado.
Análisis de Liquidez:
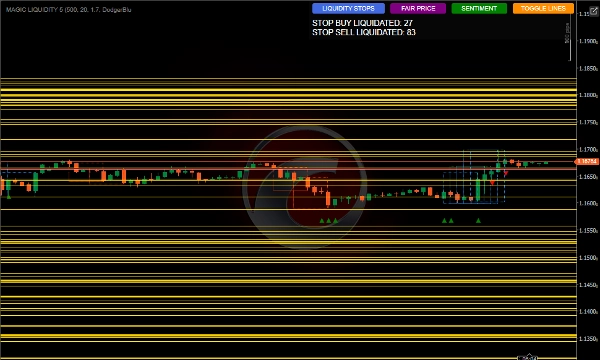
Detecta áreas de piscinas de liquidez donde pueden concentrarse órdenes de stop loss.
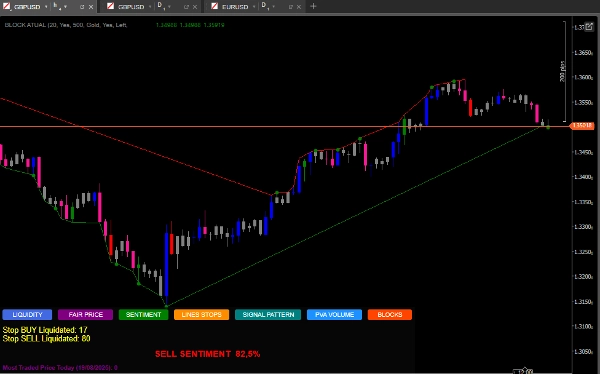
Monitorea la activación de stops de compra y venta.
Calcula el sentimiento del mercado basado en la distribución de liquidez.
Identifica el precio justo más negociado.
Cómo usar para mejores resultados
Configuración Inicial
Período de Retroceso: Ajusta el parámetro Período de Retroceso según el marco temporal en el que operes; valores más altos para marcos temporales mayores.
Número de Velas para Análisis: Manténlo en 500 para un análisis robusto o redúcelo para reacciones más rápidas.
Color de la Piscina de Liquidez: Elige un color que destaque en tu gráfico.
Interpretación de Señales
Señales de Bloque de Orden:
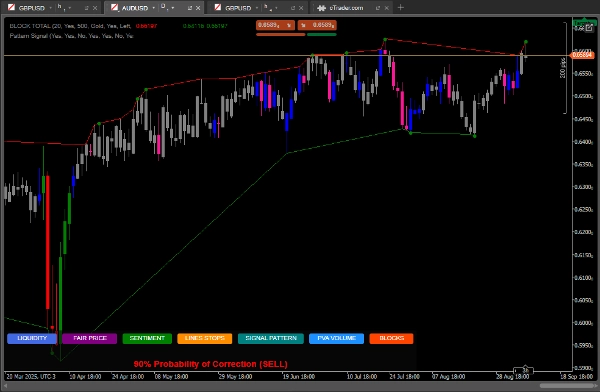
Puntos verdes: señales de compra cuando el precio cierra por encima de un mínimo no superado.
Puntos rojos: señales de venta cuando el precio cierra por debajo de un máximo no superado.
Piscinas de Liquidez:
Las líneas horizontales muestran áreas de liquidez, objetivos potenciales o puntos de reversión.
Monitorea la relación entre la liquidez por encima/debajo del precio actual.
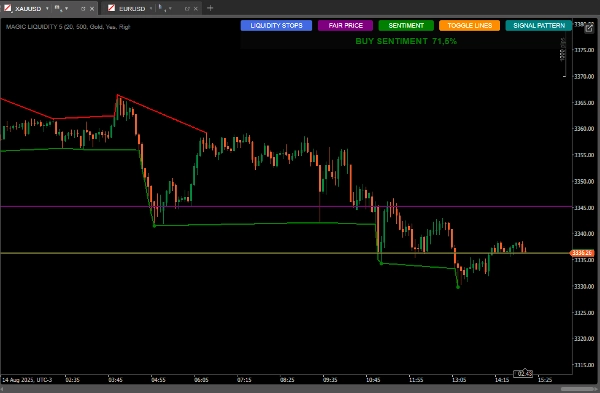
Sentimiento del Mercado:
Usa el botón SENTIMENT para ver la dirección predominante y la confianza.
Un sentimiento de compra con alta confianza sugiere crecimiento continuo. Un sentimiento de venta con alta confianza sugiere continuación bajista.
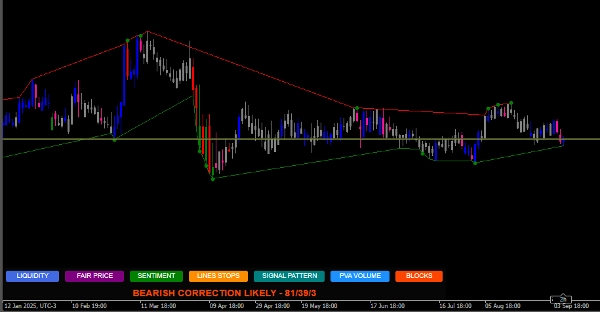
Patrones de Velas:
El botón SIGNAL PATTERN analiza y
Muestra probabilidades de corrección basadas en la relación cuantitativa
Precio Justo Más Negociado:
El botón PRICE muestra el nivel de precio con el mayor volumen del día.
Puede actuar como un imán para los precios o como soporte/resistencia.
Estrategias de Uso
Estrategia Conservadora:
Opera solo cuando las señales de bloque de orden coincidan con el sentimiento predominante.
Usa las piscinas de liquidez como objetivos de toma de ganancias.
Estrategia Agresiva:
Anticipa reversiones cuando el precio se acerca a piscinas de liquidez con muchas órdenes de stop acumuladas.
Usa divergencias entre el sentimiento y la acción del precio para operaciones contra la tendencia.
Confirmación Adicional:
Compara con el patrón de velas mostrado por el indicador.
Verifica si el precio justo está cerca como área de interés.
Gestión de Riesgos.
Stop-Loss:
Coloca debajo del bloque de orden más reciente para compras
Coloca encima del bloque de orden más reciente para ventas
Take-Profit:
Objetivos en piscinas de liquidez cercanas
Considera la proporción de liquidez arriba/abajo para establecer objetivos
Consejos Avanzados
Usa el botón TOGGLE LINES para desactivar las líneas de liquidez cuando el gráfico se vuelva saturado
Monitorea el conteo de stops liquidados para evaluar la fuerza del movimiento
El precio justo es especialmente útil en mercados laterales como soporte/resistencia dinámico
Combina con otros indicadores para confirmación volumen, medias móviles
SIGNAL PATTERN DISPONIBLE EN EL MARCO TEMPORAL D1.
https://ctrader.com/pt/products/1725?u=Goulart
https://ctrader.com/pt/products/1386?u=Goulart
Resumen
The indicator also analyzes liquidity pools, highlighting areas where stop losses may accumulate and monitoring the activation of buy and sell stops. It calculates market sentiment based on liquidity distribution and identifies the most traded price level of the day, which can act as dynamic support or resistance.
Users can customize parameters such as lookback period and number of candles for analysis to suit different timeframes and trading styles. Visual signals include green and red dots for buy and sell order block signals, horizontal lines for liquidity pools, and sentiment indicators showing prevailing market direction and confidence.
The tool supports conservative strategies that align order block signals with sentiment and use liquidity pools as profit targets, as well as aggressive strategies that anticipate reversals near liquidity pools and exploit divergences between sentiment and price action. Additional features include candlestick pattern correction probabilities and options to toggle liquidity lines for chart clarity. Risk management guidance suggests placing stop-loss orders relative to recent order blocks and setting take-profit targets near liquidity pools.


![Logotipo de "[Hamster-Coder] Bollinger Bands"](https://cdn.ctrader.com/image/webp/21d8e5d6-fb11-4bac-b9ee-cd05c2b76804_30327)

