
HIGHS LOWS AEGIS
مؤشر
1 عمليات الشراء
الإصدار 1.0، Dec 2025
Windows, Mac
5.0
التقييمات: 2
الوصف
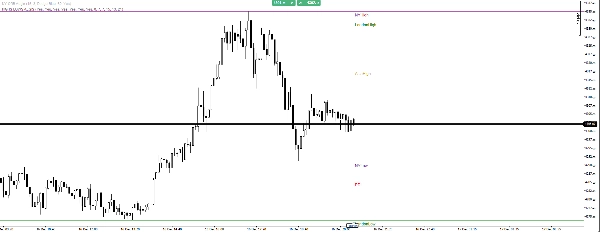
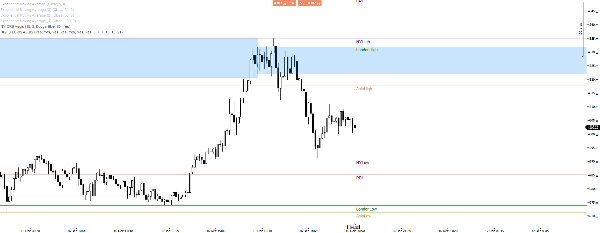
مؤشر بسيط يعرض القمم والقيعان المختارة.
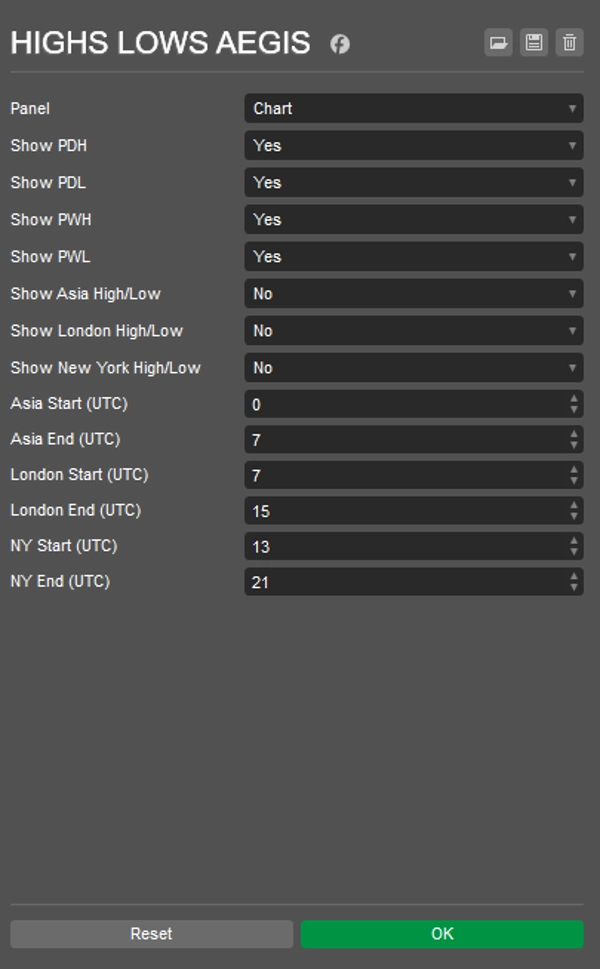
- أدنى/أعلى سعر لليوم السابق
- أدنى/أعلى سعر للأسبوع السابق
- أدنى/أعلى جلسات آسيا/لندن/نيويورك
- وقت UTC قابل للتخصيص لكل بداية/نهاية جلسة
خطوط معنونة لرؤية أفضل لما هو ماذا.
استخدام جيد مع أي استراتيجية تقريبًا، أستخدمه مع ORB، الذي يساعد كثيرًا في تجنب الاختراقات الكاذبة، كما في الصورة اليوم مع XAUUSD.
الملخص
ملف تعريف المؤشر
تقييمات العملاء
5.0
التقييمات: 2
5 | 100 % | |
4 | 0 % | |
3 | 0 % | |
2 | 0 % | |
1 | 0 % |
تقييمات العملاء
December 27, 2025
December 24, 2025
weak ideas are easier to skip, but it should stay in the support stack.
مناقشة
الأسئلة الشائعة
Prop
Forex
Breakout
Scalping
Indices
EURUSD
Commodities
SMC
Stocks
XAUUSD
NAS100
يتم توفير المنتجات المتاحة من خلال cTrader Store، بما في ذلك روبوتات التداول والمؤشرات والإضافات، من قبل مطوري الطرف الثالث وإتاحتها لأغراض الوصول المعلوماتي والفني فقط. cTrader Store ليس وسيطًا ولا يقدم نصائح استثمارية أو توصيات شخصية أو أي ضمان للأداء المستقبلي.

![شعار "[Stellar Strategies] MARSI Signal Plotter"](https://cdn.ctrader.com/image/webp/7b2b8da6-8f8e-4646-8d4a-4710c516c01e_25567)


السعر
منذ 14/04/2025
1
المبيعات