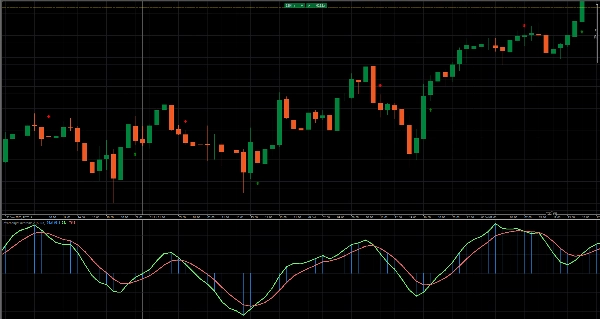
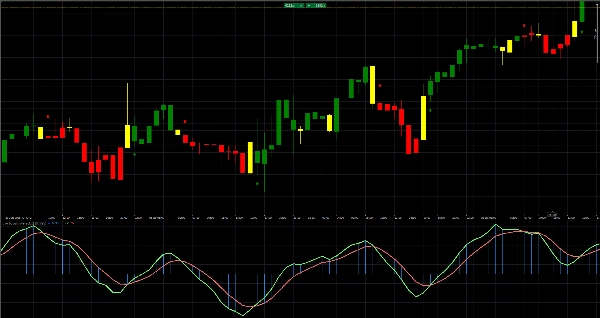
الوسطاء وشركات پروپ
للأعمال
00
Days
:
00
Hours
:
00
Minutes
:
00
Seconds
مؤشر
NAS100
NZDUSD
Martingale
Forex
Fibonacci
EURUSD
MACD
BTCUSD
SMC
Indices
ATR
Stocks
Grid
RSI
Breakout
XAUUSD
FVG
Commodities
Signal
Bollinger
GBPUSD
AI
VWAP
ZigZag
Prop
Supertrend
Crypto
USDJPY
Scalping
overbought oversold
16/12/2025
2
Desktop
منذ 12/03/2025
المبيعات
18
التثبيتات المجانية
67
صورة "overbought oversold" المحملةصورة "overbought oversold" المحملة

✅ Identifies overbought & oversold conditions with normalized momentum
✅ Uses a smoothed EMA-based central price for stable signal generation
✅ Displays dual histograms (Oo & Ll) to visualize momentum pressure
✅ Color-coded bars instantly show bullish, bearish or indecisive phases
✅ Marks precise BUY & SELL points with strict crossover arrows

Elevate your timing with the Overbought / Oversold Indicator: it computes a smoothed central price (ys1) via EMA, normalizes momentum through standard deviation, and plots dual histograms (Oo & Ll) alongside up/down EMA lines. Color-coded bars instantly highlight bullish (green), bearish (red) or indecisive (yellow) momentum shifts, while strict crossover arrows mark precise buy and sell points. Add this overlay to your chart for crystal-clear overbought/oversold signals and confidently time your entries and exits!

Also available as CBOT overbought oversold cbot cBot - cTrader Store

0.0
التقييمات: 0
تقييمات العملاء
لا توجد تقييمات لهذا المنتج حتى الآن. هل جرَّبته بالفعل؟ كن أول من يخبر الآخرين!
المزيد من هذا المؤلف
مؤشر
Grid
NAS100
RSI
+19
Know sure thing
Know Sure Thing (KST) momentum engine
مؤشر
Grid
RSI
Breakout
+19
Buy and sell indicator
Buy and Sell Signals
مؤشر
NAS100
NZDUSD
Martingale
+26
RollingZSoreTrend V1
Rolling Z-Score Trend, A clean, statistical trend & momentum indicator
مؤشر
Grid
Breakout
Martingale
+4
Coloring Trendline with arrows
Coloring trendline/ Colored Trendline / Color Trendline
مؤشر
NAS100
NZDUSD
Martingale
+22
ALGO-XL KST HeatPulse Pro
A modern Know Sure Thing (KST) momentum oscillator with ALGO-XL style heat visualization, clean signals.
مؤشر
NAS100
NZDUSD
Martingale
+25
Aggressive Entry Momentum MACD Power Guide
Entry Momentum MACD Power Guide
مؤشر
NAS100
NZDUSD
Martingale
+26
The Professional “All-in-One” Trading Suite
The Professional “All-in-One” Trading Suite (buy and sell indicator)
مؤشر
NAS100
NZDUSD
Martingale
+26
The Gap Detector
The Gap Detector Detects gap-ups and gap-downs automatically in real time
مؤشر
Grid
Indices
Breakout
+9
crossover 1
Crossover Buy and Sell Alerts and signals
مؤشر
Grid
XAUUSD
Breakout
+12
heatmap kopie
Dynamic Liquidity Depth exposes hidden volume
مؤشر
NAS100
NZDUSD
Martingale
+26
Support and Resistance
Support and Resistance with signals
قد يعجبك أيضًا
Candle Timer & Strength Demo
Candle Timer & Strength DEMO for cTrader This is a DEMO version of the Candle Timer & Strength indicator. You can use al
الأعلى تقييمًا
مجاني
مؤشر
Grid
Indices
Prop
+4
Round Numbers
Automatically draws major, minor, and trace support/resistance levels at round numbers
مؤشر
NAS100
XAUUSD
Forex
+5
Market Sessions Pre
The Market Sessions indicator is a popular tool for visually representing global trading sessions on a price chart.
مؤشر
Grid
Breakout
Martingale
+4
Coloring Trendline with arrows
Coloring trendline/ Colored Trendline / Color Trendline
الأعلى تقييمًا
مجاني
مؤشر
ATR
Supertrend
PMAX
It's a combination of two trailing stop loss and the other one is well-known ATR-based SuperTrend.
Daily SD Levels - Indicator
Plots intraday VWAP and dynamic ±1/±2 standard deviation (SD) bands based on current day’s price and volume.
مؤشر
Prop
ATR
Forex
+2
SpreadGuard Cost Spread Overlay
Displays live spread and estimated trading cost directly on chart to help assess conditions before entering a trade.
مؤشر
Forex
Signal
Supertrend
CandleColourFlow EURCAD Demo 1.1 UPGRADE
Innovative indicator that highlights trend direction and momentum strength quickly and clearly on Forex charts.
مؤشر
RSI
Breakout
XAUUSD
+13
LIQUIDITY POOL SIGNAL PRO
INDICATOR,LIQUIDITY POOLS,ACCURATE SIGNAL, NO DELAY,80% PROBABILITY
مؤشر
Breakout
Forex
On Balance Volume
On Balance Volume (OBV) measures buying and selling pressure as a cumulative indicator.
Goldenhours
The Session Golden Hours indicator is designed for serious traders looking to visualize high-probability
مؤشر
VWAP
ZigZag
RSI
+6
RSI T3 overbought and oversold area
مؤشر
EURUSD
Compare Symbol
Plots chosen symbol's close price, candlestick (wick, body) on cTrader chart, supports multiple timeframes.
مؤشر
RSI
Breakout
XAUUSD
+4
Multi-Level Candle Bias Tracker
Price direction by calculating the probability of reaching new highs/lows. Shows levels & stats📈
مؤشر
NAS100
NZDUSD
XAUUSD
+12
Footprint Chart_noSourceCode
"Footprint Chart: Visualize bid-ask volume inside candles for clearer order flow and market depth insights."
الأعلى تقييمًا
مجاني
AlphaTrend Pro by LudwigICT
مؤشر
RSI
Commodities
Signal
+1
Dot Momentum %BB Indicator
Dynamic circles visualize price's volatility position. Like RSI for market overextension & stretch. Quantify context.
MultiTF-Pivot_SR
MultiTF Pivot and SR Indicator