الوصف
صائد المؤشرات: نظرة عامة
صائد المؤشرات هو مؤشر فني متخصص ونظام دعم اتخاذ القرار مصمم بشكل أساسي لمؤشرات عالية التقلب مثل US30 (داو جونز) و NAS100 (ناسداك). على عكس المؤشرات القياسية التي تعرض فقط البيانات السابقة، يركز صائد المؤشرات على "التنبؤ الاتجاهي"—محاولًا توقع مكان السعر بعد 4 شموع في المستقبل بناءً على السرعة الحالية (الميل) عبر أطر زمنية متعددة.
1. الآليات الأساسية (كيف يعمل)
أ. محرك التنبؤ "الاتجاهي"
هذا هو جوهر الأداة. فهو لا ينظر فقط إلى السعر الحالي؛ بل يحسب معدل التغير (الميل) عبر أطر M5 و M15 و H1 لرسم "المسار المستقبلي" على الرسم البياني الخاص بك.
- الآلية: يحسب متوسطًا مرجحًا للزخم من أطر زمنية مختلفة لتوقع 4 نقاط (P1، P2، P3، P4) في المستقبل.
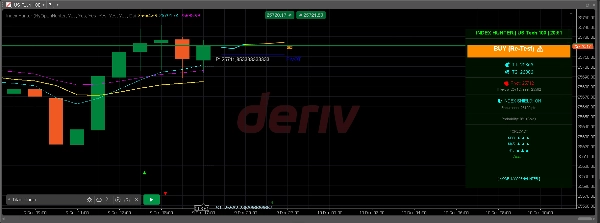
- المرئي: ترى مسارًا ملونًا (سماوي -> أصفر -> برتقالي) يمتد إلى يمين السعر، يصور زخم السوق.
- المسار الشبح: كما يتذكر التنبؤ السابق (المسار الشبح) حتى تتمكن من رؤية ما إذا كان السوق يحترم توقعات الخوارزمية السابقة ("فحص الواقع").
ب. نظام بصري متعدد الطبقات
يقوم بتراكب المستويات المؤسسية الحرجة تلقائيًا:
- نقاط المحور (مرنة): تحسب تلقائيًا مستويات المحور، R1/S1، و R2/S2 بناءً على إطار زمني قابل للاختيار (H12، يومي، يوم2، أو يوم3).
- المستويات النفسية: ترسم "خطوط نفسية" عند كل فاصل 100 نقطة (مثلاً، 34000، 34100)، والتي غالبًا ما تعمل كمناطق جذب للمؤشرات.
- أعلى/أدنى يومي: تحدد نطاق اليوم السابق لتظهر مناطق الاختراق أو الرفض.
- الفراكتلات: تحدد القمم والقيعان المحلية بأسهم (▲ ▼) لوضع دخول/وقف خسارة دقيق.
ج. منطق "الثقة" والجدوى
الأداة لا تعطي إشارة فقط؛ بل تقوم بتقييمها.
- الحساب: يقيس المسافة إلى هدف الربح الخاص بك ويقارنها مع طاقة السوق الحالية (ATR - متوسط النطاق الحقيقي).
- الناتج:
-
- حار (>80%): زخم قوي + مسافة هدف معقولة.
- دافئ (50-80%): إعداد متوسط.
- بارد (<50%): السوق يفترض احتمالًا منخفضًا للوصول إلى الهدف (مثلاً، الهدف بعيد جدًا بالنسبة للتقلب الحالي).
د. آليات "درع" الحساب
يشمل مدير مخاطر سلبي على اللوحة:
- مقياس التحمل: يحسب كم "نقطة" يمكن للسوق أن يتحرك ضدك قبل أن يكون حسابك في خطر، بناءً على رصيدك وأدنى حجم لوت.
- الحالة: يعرض "🛡️ درع المؤشر: تشغيل" إذا كان حسابك آمنًا بالنسبة للتقلب الحالي (ATR)، أو "⚠️ هامش منخفض" إذا كان التقلب مرتفعًا جدًا بالنسبة لرصيدك.
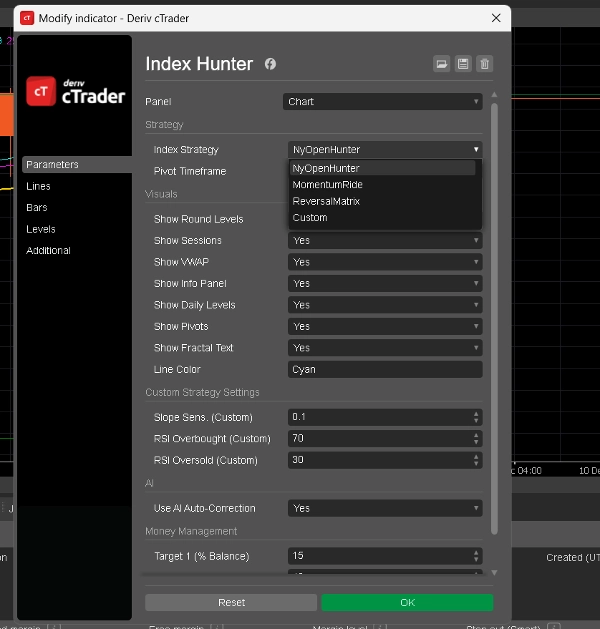
2. الأوضاع المتاحة (الاستراتيجيات)
يمكنك التبديل بين هذه الأوضاع في إعدادات المؤشر (
استراتيجية المؤشر
المعلمة). كل وضع يغير كيفية تفسير الذكاء الاصطناعي للسوق.
1. الوضع: NyOpenHunter (المتداول السريع في نيويورك)
- الأفضل لـ: الساعات الأولى الفوضوية 2-3 من افتتاح السوق الأمريكي.
- المنطق:
-
- الوقت النشط: 13:00 - 17:00 بالتوقيت العالمي المنسق (تقريبًا).
- المحفز: يبحث عن ميل M5 أكبر من 0.1 (أو أقل من -0.1).
- الفلسفة: "اقتنص الانفجار." ينتظر الاندفاع الأولي للحجم عند جرس نيويورك ويشير إلى ركوب تلك الموجة المحددة.
- مشاعر اللوحة: يعرض "شراء افتتاح نيويورك 🚀" أو "بيع افتتاح نيويورك 🔻".
2. الوضع: MomentumRide (متابع الاتجاه)
- الأفضل لـ: الاتجاهات القوية والمستمرة خارج فترة الافتتاح.
- المنطق:
-
- المحفز: يتطلب ميل M5 أقوى (> 0.2) من وضع نيويورك.
- الفلسفة: "لا تتعرض للتقطيع." يتجاهل الحركات الضعيفة ويشير فقط عندما يتحرك السوق بقناعة كبيرة.
- مشاعر اللوحة: يعرض "زخم صاعد 🟢" أو "زخم هابط 🔴".
3. الوضع: ReversalMatrix (مضاد للاتجاه)
- الأفضل لـ: الأسواق المتذبذبة أو التقاط القمم/القيعان.
- المنطق:
-
- المحفز: يستخدم مؤشر القوة النسبية (RSI).
-
- إشارة بيع: RSI > 75 (تشبع شراء).
- إشارة شراء: RSI < 25 (تشبع بيع).
- الفلسفة: "تراجع عن التطرف." يحدد متى يتم شد الشريط المطاطي بعيدًا جدًا ومن المحتمل أن يعود بسرعة.
- مشاعر اللوحة: "تشبع شراء (بيع قريبًا)" أو "تشبع بيع (شراء قريبًا)".
4. الوضع: مخصص (تعريف المستخدم)
- الأفضل لـ: المستخدمين المتقدمين الذين يرغبون في ضبط الروبوت.
- المنطق: يسمح لك بتعيين عتباتك الخاصة لـ حساسية الميل و مستويات RSI في الإعدادات.
-
- مثال: يمكنك إنشاء استراتيجية هجينة تشتري فقط إذا كان الميل > 0.05 و RSI < 40.
3. "لوحة المعلومات" (شاشة العرض الأمامية)
تجمع اللوحة المرئية على الجانب الأيمن من الرسم البياني كل هذه البيانات:
- العنوان: يعرض الوضع الحالي والرمز.
- التفضيل: الانحياز الرئيسي للذكاء الاصطناعي (مثلاً، "شراء 34150 ▲").
- الأهداف (T1، T2): أهداف ربح ديناميكية محسوبة بناءً على إعدادات نسبة حسابك والتقلب.
- التوقع: تحليل تسلسلي لاتجاهات M30، M45، و H1 (مثلاً، "M30: ▲ ▲ ▲" يعني توافق شراء قوي).
- الاحتمالية: درجة ثقة الذكاء الاصطناعي (حار/دافئ/بارد).
الملخص
Key features include an automatic overlay of institutional levels such as pivot points (with selectable timeframes), psychological price levels at 100-point intervals, previous day’s high/low, and fractals marking local tops and bottoms. It incorporates a confidence grading system (Hot, Warm, Cold) based on momentum strength and volatility relative to profit target distance.
Index Hunter includes a risk management "Shield" that assesses account safety by calculating potential adverse market moves against account balance and lot size, displaying status alerts accordingly.
The indicator offers four operational modes: NyOpenHunter (New York market open scalping), MomentumRide (trend following), ReversalMatrix (counter-trend using RSI), and a Custom mode for user-defined slope and RSI thresholds. A comprehensive info panel consolidates mode, bias, dynamic targets, trend forecasts, and confidence scores for decision support.
تقييمات العملاء
5 | 67 % | |
4 | 33 % | |
3 | 0 % | |
2 | 0 % | |
1 | 0 % |