
IM_AngleIndicator
مؤشر
1 عمليات الشراء
الإصدار 2.0، Jul 2026
Windows, Mac
4.5
التقييمات: 2
الوصف
IM_AngleIndicator يحول ميل المتوسط المتحرك البسيط إلى مقياس زاوي موضوعي وقابل للمقارنة.
معظم مؤشرات "الزاوية" تحسب الميل من تغير السعر الخام، لكن النتيجة تعتمد على المقياس المطلق للأداة والفترة الزمنية — لذا فإن نفس قيمة الدرجة تعني أشياء مختلفة تمامًا على زوج عملات، أو مؤشر، أو عملة مشفرة. يحل IM_AngleIndicator هذه المشكلة عن طريق تطبيع تغير المتوسط المتحرك البسيط بواسطة ATR: يتم التعبير عن الميل بـ "ATR لكل شريط" ثم يتم تحويله إلى درجات. بهذه الطريقة، يمثل ميل 45° دائمًا حركة بمقدار 1 ATR لكل شريط، بغض النظر عن الأداة أو الفترة الزمنية التي يتم تحليلها. النتيجة هي قراءة متسقة وحدود يمكن إعادة استخدامها عبر المحفظة بأكملها.
كيف يعمل
- يحسب المتوسط المتحرك البسيط على أسعار الإغلاق وفقًا للفترة المختارة.
- يقيس تغيره بين شريطين متتاليين ويطبعّه بقسمة التغير على ATR.
- يحول النسبة الناتجة إلى درجات عبر الدالة العكسية للظل، معيدًا قيمة تقريبية بين −90° و +90°.
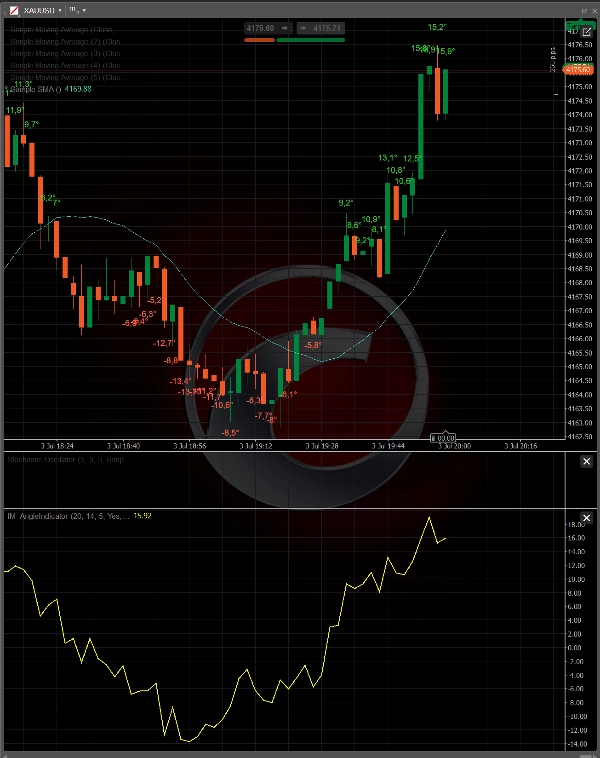
- يرسم القيمة كمذبذب في لوحة مخصصة وعندما يتجاوز الميل الحد المعين، يضيف تسمية على مخطط السعر موضوعة فوق القمة (اتجاه صعودي) أو تحت القاع (اتجاه هبوطي).
الميزات الرئيسية
- قياس الميل مستقل عن الأداة والفترة الزمنية بفضل تطبيع ATR.
- حد قابل للتكوين بالدرجات لتصفية الحركات المهمة واستبعاد الضوضاء.
- تسميات ملونة حسب الاتجاه (أخضر للصعود، أحمر للهبوط) مع إزاحة رأسية تعتمد على ATR لوضع نظيف بالنسبة للشموع.
- معالجة محسنة لكائنات المخطط: التسميات محدودة على الأشرطة الأحدث للحفاظ على الأداء حتى في المخططات ذات التاريخ الطويل.
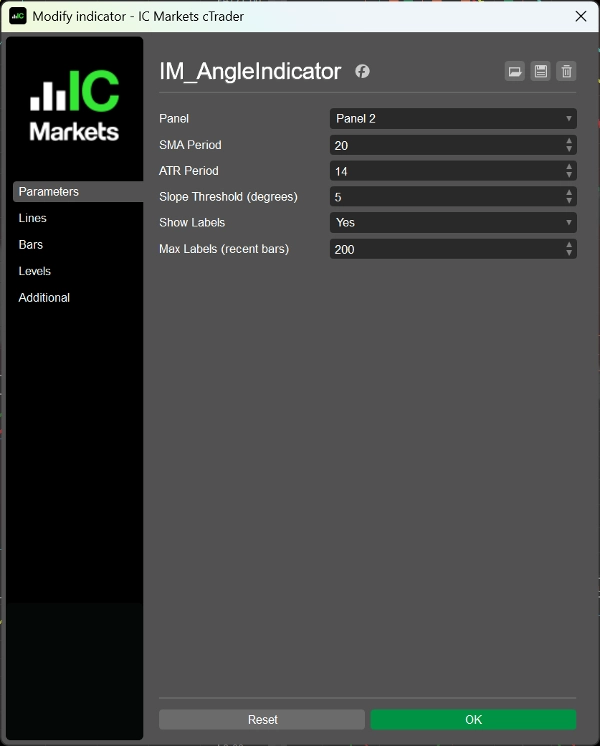
- معلمات قابلة للتخصيص بالكامل: فترة المتوسط المتحرك البسيط، فترة ATR، حد الميل، ظهور التسمية، والحد الأقصى لعدد التسميات.
حالات الاستخدام
- تحديد مراحل الاتجاه القوي مقابل النطاقات الجانبية.
- تأكيد الاتجاه لدعم استراتيجيات الدخول والخروج.
- مقارنة قوة الاتجاه عبر أدوات متعددة باستخدام نفس الحد.
- أساس لتطوير cBots التي تستخدم الميل المطبع كإشارة تداول.
الملخص
ملف تعريف المؤشر
فئة المؤشر
الاتجاه
نوع المخرجات
التصور
متطلبات البيانات
أعمدة السعر فقط
الإشارات المدعومة
قوة الاتجاه
تقييمات العملاء
4.5
التقييمات: 2
5 | 50 % | |
4 | 50 % | |
3 | 0 % | |
2 | 0 % | |
1 | 0 % |
تقييمات العملاء
November 19, 2024
The setup needs a cleaner reason to exist, but sideways markets can fake the filter.
November 13, 2024
kinda useful when the chart is messy. It can look better than it is during a lucky run.
مناقشة
الأسئلة الشائعة
Forex
Signal
EURUSD
Commodities
XAUUSD
يتم توفير المنتجات المتاحة من خلال cTrader Store، بما في ذلك روبوتات التداول والمؤشرات والإضافات، من قبل مطوري الطرف الثالث وإتاحتها لأغراض الوصول المعلوماتي والفني فقط. cTrader Store ليس وسيطًا ولا يقدم نصائح استثمارية أو توصيات شخصية أو أي ضمان للأداء المستقبلي.


السعر
منذ 11/11/2024
33.44M
حجم التداول
72.4K
الربح بالبيب
1
المبيعات