Mô tả
Vùng Thanh Khoản Heatmap
Trực quan hóa khối lượng theo giá, khám phá hỗ trợ/kháng cự ẩn, và theo dõi thanh khoản thị trường theo thời gian thực.
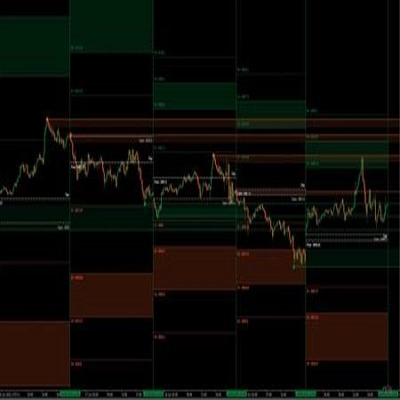
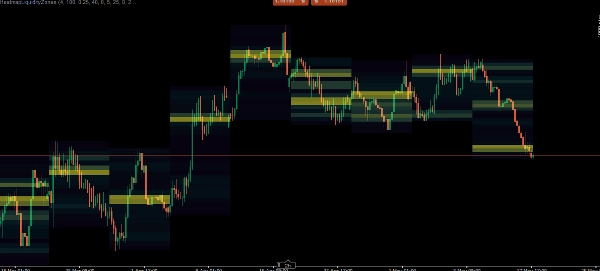
Chỉ báo Vùng Thanh Khoản Heatmap là một công cụ phân tích khối lượng mạnh mẽ chuyển đổi dữ liệu thị trường thô thành một bản đồ nhiệt trực quan dễ hiểu. Bằng cách phân tích khối lượng tick trên các khung thời gian cao hơn cụ thể (HTF), nó xác định chính xác nơi tập trung áp lực mua và bán đáng kể nhất.
Thay vì đoán nơi thị trường có thể đảo chiều, chỉ báo này vẽ các mức thanh khoản chính xác dựa trên khối lượng. Các mức này mở rộng về phía trước một cách động và tự động biến mất khi giá phá vỡ và làm mất hiệu lực chúng, giữ cho biểu đồ của bạn sạch sẽ và chỉ liên quan đến hành động giá hiện tại.
Tính Năng Chính
Heatmap Đa Khung Thời Gian: Chọn khung thời gian vĩ mô ưa thích của bạn (1H, 4H, Hàng ngày, Hàng tuần hoặc Hàng tháng). Chỉ báo sẽ lập bản đồ phân phối khối lượng cho khoảng thời gian đó trực tiếp lên các biểu đồ khung thời gian thấp hơn của bạn.
Phân Bổ ATR Động: Thang giá được chia thành các "khoang" (vùng) động được tính toán bằng cách sử dụng Phạm vi Thực Trung bình (ATR). Điều này đảm bảo heatmap thích ứng thông minh với cả thị trường biến động cao và thị trường tích lũy chặt chẽ.
Mức Thanh Khoản Tự Hủy: Khi một khoang giá cụ thể tích lũy một lượng lớn khối lượng, nó trở thành một "Mức Thanh Khoản." Chỉ báo vẽ một đường thẳng kéo dài về phía tương lai. Nếu giá phá vỡ thành công mức này, đường sẽ tự động bị loại bỏ (mất hiệu lực).
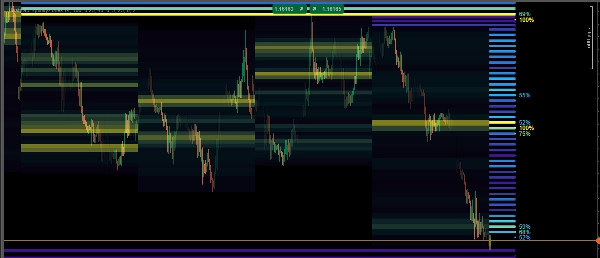
Tô Màu Độ Dốc Mật Độ: Phân biệt trực quan giữa các nút khối lượng Thấp, Trung bình và Cao. Heatmap sử dụng một dải màu để cho bạn thấy chính xác nơi khối lượng nặng nhất bị giữ lại.
Theo Dõi Phần Trăm: Các mức thanh khoản mật độ cao hiển thị nhãn phần trăm (ví dụ, 85%), cho thấy chính xác nút đó mạnh đến mức nào so với phần còn lại của khối lượng trong khoảng thời gian HTF.
Tóm tắt
The indicator segments the price scale into dynamic zones based on the Average True Range (ATR), adapting to market volatility. It highlights significant volume clusters as liquidity levels with solid lines extending forward. These lines automatically disappear if the price breaks through the level, ensuring the chart remains focused on relevant, current price action.
A color gradient visually distinguishes low, medium, and high volume nodes, while percentage labels indicate the relative strength of high-density liquidity levels within the chosen timeframe. This tool supports traders in tracking market liquidity in real-time and making volume-backed decisions regarding support and resistance areas.
Đánh giá của khách hàng
5 | 100 % | |
4 | 0 % | |
3 | 0 % | |
2 | 0 % | |
1 | 0 % |














![Logo "[Stellar Strategies] Smart ADX"](https://cdn.ctrader.com/image/webp/af13b084-b6f6-41db-b7bc-c7e688b57b05_36929)