
RT Standard Deviation Channel_noSourceCode
指标
1 购买
版本 1.0, Dec 2024
Windows 版、Mac 版
说明
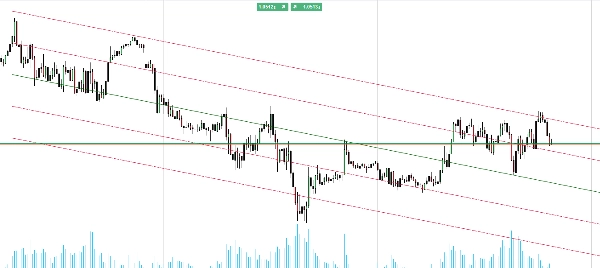
介绍 标准差通道 指标,适用于 cTrader,是一个强大的工具,旨在帮助您精准地可视化市场趋势。
该指标在您的图表上显示指定周期的中位数,提供价格变动的中心参考点。
此外,它允许您添加所需数量的上下通道,按标准差的倍数计算,让您清晰地看到价格波动性和潜在的突破区域。
标准差通道指标非常适合寻求增强分析能力的交易者,帮助您轻松识别趋势方向和潜在的反转点。
使用标准差通道升级您的交易工具包,实现更优的市场分析和决策。
摘要
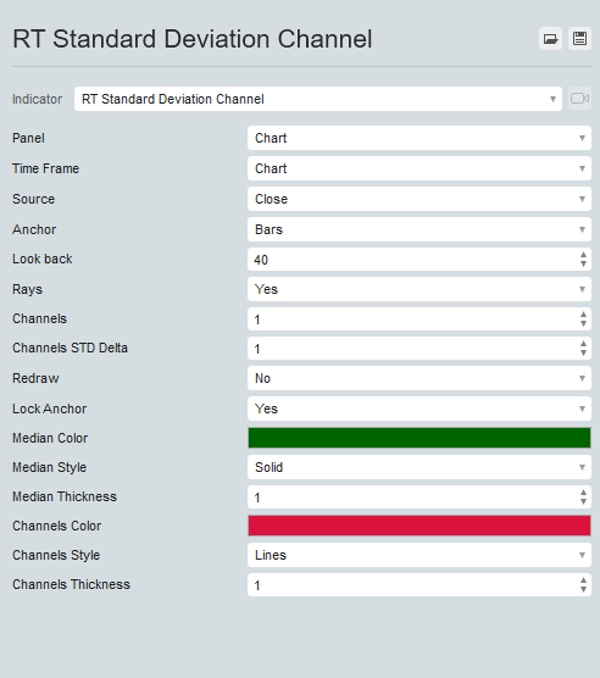
指标配置
客户评价
0.0
评价:0
客户评价
该产品尚无评价。已经试过了?抢先告诉其他人!
讨论
常见问答
BTCUSD
Forex
Breakout
Indices
EURUSD
Commodities
GBPUSD
NZDUSD
Crypto
Stocks
XAUUSD
NAS100
USDJPY
cTrader Store 提供的所有产品,包括交易机器人、指标和插件,均由第三方开发者提供,仅供信息参考和技术访问之用。cTrader Store 并非经纪商,不提供投资建议、个人推荐或任何未来业绩保证。
猜您喜欢


价格
注册日期 25/09/2024
20
销售