
说明
CHoCH 突破块
https://chartshots.spotware.com/c/69960085a796e
此指标专为使用 价格行为 和 智能资金概念(SMC) 方法的交易者设计。推荐用法:
- 🔍 识别 CHoCH 作为可能结构反转的第一个信号。
- 👀 观察生成的 兴趣区 :这是价格通常在继续新方向前回归的区域。
- ⏳ 等待价格 回到该区域,并在其中寻找与 斐波那契水平 的汇合点(特别是 0.382、0.5、0.618 和 0.786)。
- ✅ 通过 吞没蜡烛 (如果处于 StructureBased 模式)在该区域内确认,以获得更高精度的入场点。
- ❌ 如果价格突破该区域的相反边界,交易将被 作废,因为指标本身会在那一刻取消该区域。
https://chartshots.spotware.com/c/699600271b05d
📊 1. 三层结构分析
该指标分析市场的 三个嵌套的层级水平,从最不重要到最重要:
- 🔹 短期:通过比较连续三根蜡烛,检测最新的局部高点和低点。当中间蜡烛低于前后两根时,确认局部低点。局部高点则相反。
- 🔸 中期:基于短期点构建。当短期波动形成连续三次确认方向的更低低点或更高高点时,建立中期点。
- 🔺 长期:以中期点为基础构建,方式完全相同。 这是最重要的层级,也是触发指标主要事件的层级。
💡 这种层级结构确保 只有具有真实结构重量的运动才会产生信号,过滤掉短期噪音。
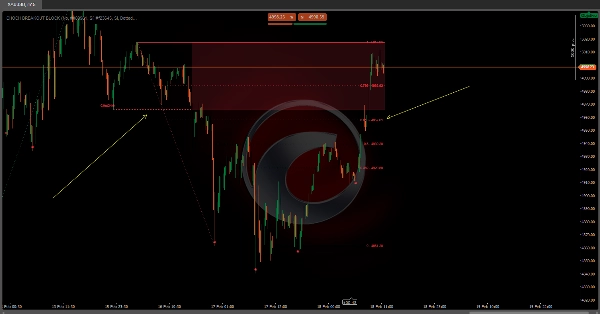
🔄 2. CHoCH — 性质变化
CHoCH 是指标的核心事件。它发生在:
- 🟢 看涨 CHoCH:价格收盘价 高于 之前的长期结构高点,而之前的市场方向为看跌。这表明卖方失去控制,市场可能向上反转。
- 🔴 看跌 CHoCH:价格收盘价 低于 之前的长期结构低点,而之前的方向为看涨。这表明买方失去控制,市场可能向下反转。
检测到 CHoCH 时,指标绘制:
- ➡️ 一条 水平线 在准确的突破水平(使用配置的样式和粗细)
- 🏷️ 一条 “CHoCH” 标签 位于该线之上
- 🟥🟩 一块 半透明兴趣区
🗺️ 3. 兴趣区
CHoCH 发生后,指标 自动划定一个关键价格区域:
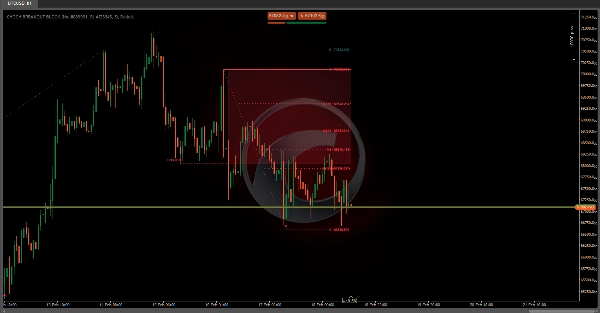
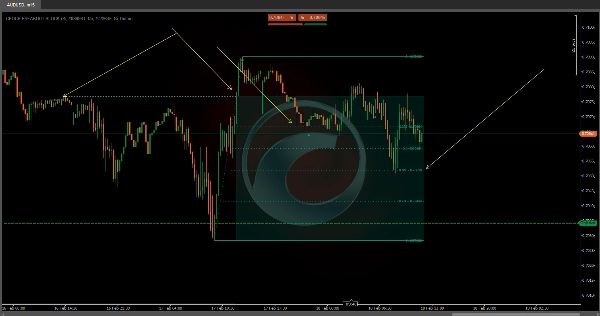
- 🟢 在看涨 CHoCH 中:该区域从突破水平(CHoCH)延伸到结构波动和突破时刻之间找到的最低点。该区域代表价格可能回归以 寻找流动性 后再继续向上。
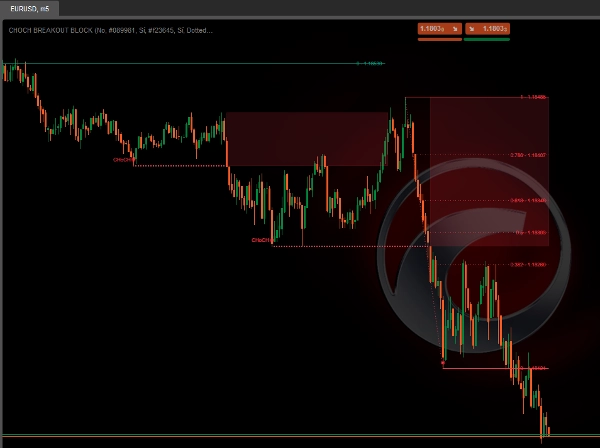
- 🔴 在看跌 CHoCH 中:该区域从波动和突破之间找到的最高点延伸到 CHoCH 水平。它代表价格可能回归以 寻找流动性 后再继续向下。
该区域 会随着每根K线自动延伸,只要价格尊重其边界。当价格突破相反边界时,区域停止延伸——表示该区域已被测试或作废。
👁️ 如图表所示,半透明红色区域代表检测到的 CHoCH 事件后的 看跌兴趣区域。
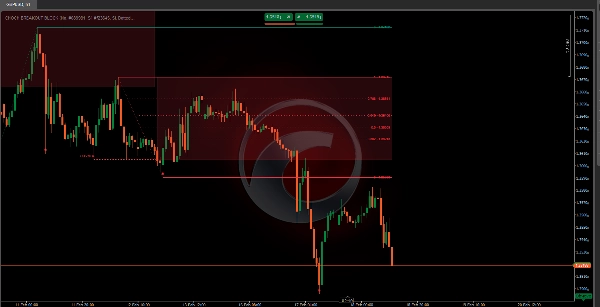
📐 4. 自动斐波那契水平
检测到 CHoCH 后, 指标不会立即绘制斐波那契线。斐波那契线会在第二阶段出现,当市场确认新方向具有真实结构重量时。过程分两步:
步骤 1 — 发生 CHoCH:🏷️ 绘制突破线、标签和兴趣区。 斐波那契线尚不可见。
步骤 2 — 市场形成新的长期波动,方向与 CHoCH 一致:📐 只有此时,指标才会自动在突破参考点和新确认的波动之间绘制斐波那契水平。
📌 示例:在看涨 CHoCH 中,斐波那契线将从突破期间找到的最低点绘制到市场随后形成的第一个长期高点。如果价格上涨但尚未巩固该结构波动, 斐波那契水平将暂不可见——这是故意设计,不是错误。
一旦激活,水平会随着每根K线延伸,只要结构有效,且 在出现新的结构突破时自动重新计算。可用水平包括:
水平
常见含义
0
运动起点
小幅回撤
⭐ 首个重要回撤
0.5
⭐ 中间水平
⭐ 黄金比例
黄金比例变体
⭐ 深度回撤
1
100% 延伸
🕯️ 5. 吞没蜡烛检测
指标包含 吞没蜡烛形态检测 作为额外的汇合信号:
- ▲ 一种 看涨吞没 出现在一根大阳线完全吞没之前的小阴线时。
- ▼ 一种 看跌吞没 出现在一根大阴线完全吞没之前的小阳线时。
有 两种显示模式:
- 📋 全部:显示图表上出现的所有吞没形态。
- 🎯 基于结构:仅显示发生在 活跃兴趣区内的吞没形态,显著提高信号的相关性。
摘要
When a CHoCH occurs, the indicator marks the breakout level with a horizontal line and label, and automatically creates a semi-transparent interest zone where price is likely to return before continuing in the new direction. This zone extends dynamically as long as price respects its boundaries and is invalidated if price breaks the opposite boundary.
The indicator also projects Fibonacci retracement levels automatically after the market confirms the new trend direction by forming a new long-term swing. Supported Fibonacci levels include 0.236, 0.382, 0.5, 0.618, 0.65, 0.786, and 1. Additionally, it detects bullish and bearish engulfing candle patterns as confluence signals, with options to display all patterns or only those occurring within active interest zones for higher precision.
This tool supports multiple markets including BTCUSD, EURUSD, GBPUSD, NZDUSD, XAUUSD, NAS100, and USDJPY.
客户评价
5 | 100 % | |
4 | 0 % | |
3 | 0 % | |
2 | 0 % | |
1 | 0 % |


