
说明
注意:仅在 cTrader Windows 上测试。
LT_Ind_Pivot 是一个功能强大且可定制的 cTrader 枢轴点指标,帮助可视化多个时间框架中的关键市场水平和交易时段结构。
它会自动计算并绘制 枢轴点 (P)、支撑位 (S1–S5)、阻力位 (R1–R5) 和 CPR (TC/BC) 水平,基于您选择的 锚定时间框架 — 从 H1、H4、H8、H12、D1、W1 到 Month1。
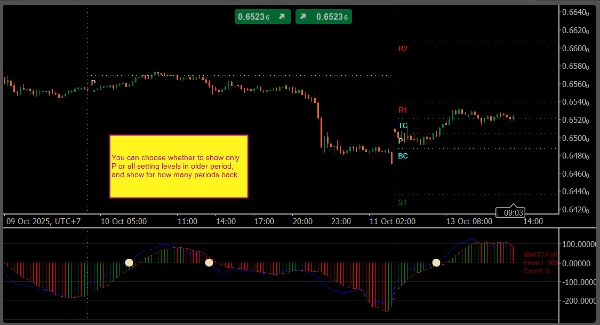
该指标还会为每个锚定周期绘制 垂直分隔线,无论是在 主图表还是 指标面板上,都能轻松区分交易时段或周期边界。
您可以使用灵活的符号精确定义要显示的级别,例如:
P, S1, R1– 标准级别PS1、S1S2、R1R2等 – 枢轴点与主要支撑/阻力之间的中间级别。TC、BC– 中心枢轴区间 (CPR)
显示控制允许您设置保留多少历史枢轴点可见,是否显示文本/价格标签,以及如何为每个级别着色或设置样式。
主要功能
- 枢轴锚点: H1、H4、H8、H12、D1、W1、Month1
- 自定义级别语法:
P、Sx、Rx、PS1、S1S2、R1R2、TC、BC - 图表和指标面板上的垂直 周期分隔线
- 可选显示文本、价格和旧枢轴点级别
- 完全自定义颜色和线条样式
- 轻量且适合实盘交易
默认设置
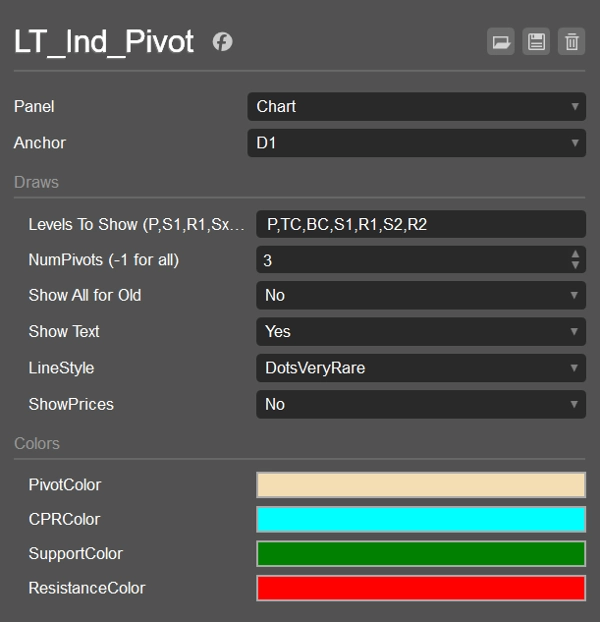
- 锚点: D1
- 显示级别:
P,S1,R1 - 历史枢轴点数量: 1
- 旧枢轴点显示全部: false
- 显示文本: true
- 显示价格: false
- 线条样式: 实线
- 颜色: 枢轴 = 小麦色,CPR = 青色,支撑 = 绿色,阻力 = 红色
使用场景
- 标记日内和波段 支撑/阻力 区域
- 跟踪 CPR 和中间级别 以识别突破或均值回归设置
- 使用 周期分隔线 分析逐时段结构
- 与 VWAP 或摆动指标结合使用以提高共识度
摘要
指标配置
客户评价
4.0
评价:1
5 | 0 % | |
4 | 100 % | |
3 | 0 % | |
2 | 0 % | |
1 | 0 % |
客户评价
October 26, 2025
Demo first, then maybe small size if the notes look sane, and It needs a boring test before bigger size.
讨论
常见问答
Prop
Forex
Indices
Commodities
Crypto
Stocks
cTrader Store 提供的所有产品,包括交易机器人、指标和插件,均由第三方开发者提供,仅供信息参考和技术访问之用。cTrader Store 并非经纪商,不提供投资建议、个人推荐或任何未来业绩保证。


!["[Hamster-Coder] Moving Average MTF" 标识](https://cdn.ctrader.com/image/webp/b11b98b1-194d-4b8e-b00e-d611826ad159_31226)


价格
注册日期 25/09/2024
34
销售