
LT_Ind_Candles
Индикатор
4 покупки
Версия 1.0, Sep 2024
Windows, Mac
4.0
Отзывы: 1
Описание
Примечание: тестировалось только на cTrader для Windows.
Модели из одной свечи:
- Доджи
- Молот
- Падающая звезда
Модели из 2 свечей:
- Поглощение
- Темная облачность
- Проникновение
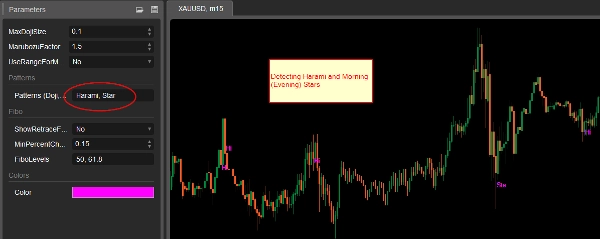
- Харами
Модели из 3 свечей:
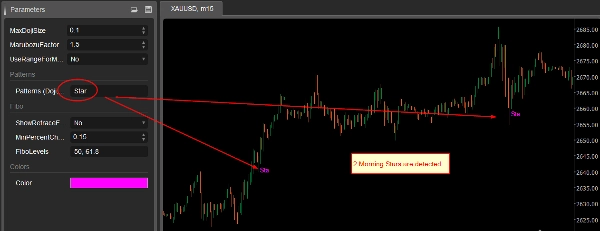
- Утренняя звезда
- Вечерняя звезда
Марубозу:
Если выбрано, размер свечей с большим телом аннотируется. Ознакомьтесь с описаниями настроек для размера.
Настройки:
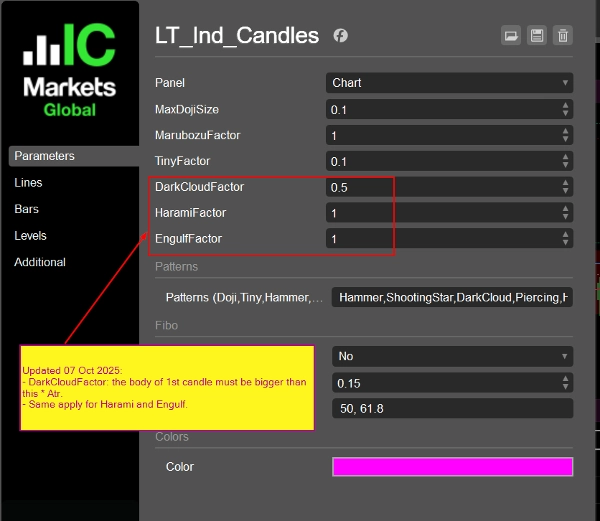
(Обновлено 07 окт 2025:
- Использовать Atr (14 периодов, простая скользящая средняя) вместо MedianBarBody
- Добавлены настройки для DarkCloud (и Piercing), Harami, факторов Engulf
)
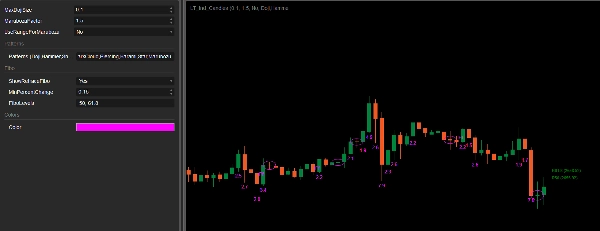
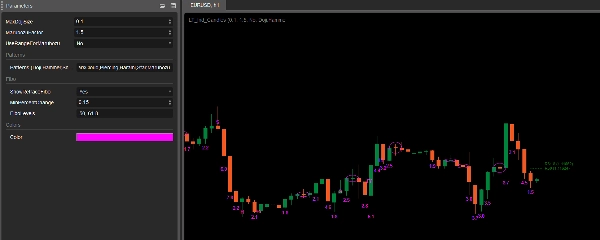
- MaxDojiSize: Максимальное отношение между телом свечи и диапазоном свечи для определения Доджи (по умолчанию 0.1).
- Фактор Марубозу: тело текущей свечи должно быть > MarubozuFactor * Atr, чтобы считаться большой свечой (Марубозу). Здесь не учитывается фитиль.
- Использовать диапазон для Марубозу: использовать BarRange (High - Low) вместо BarBody (Open - Close).MathAbs() при проверке Марубозу.
- Модели: укажите модели, которые хотите обнаружить, через запятую. Допустимые значения: Doji,Hammer,ShootingStar,Engulf,DarkCloud,Piercing,Harami,Star,Marubozu. Обратите внимание, что если выбрать "Star", будут обнаружены и утренняя, и вечерняя звезды.
- Показать уровни Фибо отката: вспомогательные уровни Фибо для контроля риска. Когда есть 2 последовательные свечи с более высоким максимумом и более высоким минимумом, рассчитываются и отображаются указанные уровни Фибо, построенные на этих 2 свечах. Вы можете удерживать вход до достижения ценой этих уровней для контроля риска. Уровни настраиваемые. Обратная ситуация аналогична (более низкий максимум и более низкий минимум).
- Минимальное процентное изменение: 2 свечи, используемые для уровней Фибо, должны образовывать изменение цены > этого процента.
- Уровни Фибо: укажите уровни через запятую.
- Цвет: цвет аннотации свечи.
Сводка
Профиль индикатора
Отзывы покупателей
4.0
Отзывы: 1
5 | 0 % | |
4 | 100 % | |
3 | 0 % | |
2 | 0 % | |
1 | 0 % |
Обсуждение
Частые вопросы
Forex
Signal
Indices
Commodities
Crypto
Stocks
ATR
Продукты, доступные в cTrader Store, включая торговых ботов, индикаторы и плагины, предоставляются сторонними разработчиками и доступны исключительно в информационных и технических целях. cTrader Store не является брокером и не предоставляет инвестиционные консультации, персональные рекомендации или какие-либо гарантии будущей доходности.


Цена
С 25/09/2024
34
Продажи