


#### 功能
- **可自定义时间框架**:用户可以选择特定的时间框架(例如每日)来分析开盘价水平。不要设置任何低于1小时的时间框架。
- **回溯周期**:该指标支持回溯周期,使交易者能够关注近期价格走势并识别相关的关注点。
- **动态趋势线**:它绘制趋势线以指示所选时间框架的开盘价,提供潜在支撑和阻力水平的清晰视觉提示。
- **标签选项**:交易者可以启用标签,直接在图表上显示开盘价,增强清晰度和理解。
- **视觉自定义**:用户可以自定义线条颜色、样式和粗细,以符合个人偏好并提高图表的可读性。
- **时间框架限制**:该指标包含检查,确保仅在指定的最小和最大时间框架设置内运行,防止误导信号。
#### 教程
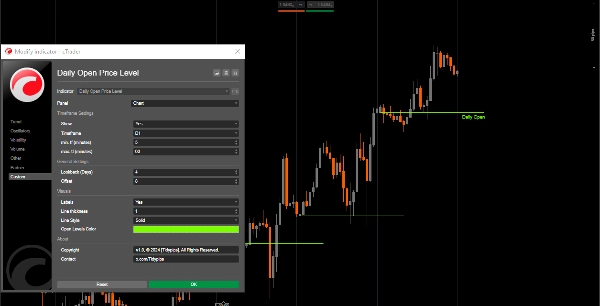
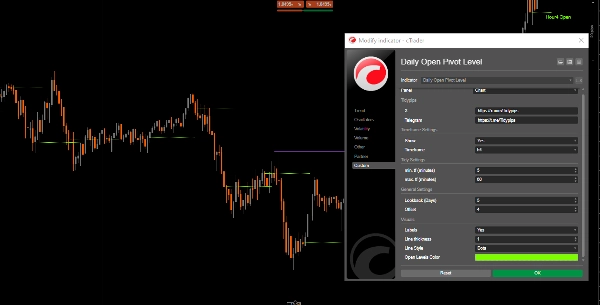
1. **设置**:打开指标设置,选择所需的时间框架、回溯周期,并自定义视觉参数,如线条颜色和粗细。
2. **使用指标**:应用后,指标将根据指定设置自动在图表上绘制开盘价水平。
3. **分析**:在交易时观察绘制的水平线。利用这些水平识别潜在的支撑和阻力区域,做出明智的交易决策。
#### 推荐配套工具
- **cTrader**:cAlgo的原生平台,提供无缝的指标使用和自定义体验。
- **技术分析工具**:将此指标与移动平均线或振荡器等其他工具结合使用,以增强交易策略和市场分析。
- **风险管理工具**:利用仓位大小计算器和止损工具,有效管理围绕识别开盘价水平的交易风险。
通过将每日开盘枢轴水平指标与这些工具集成,交易者可以增强市场分析能力,提高在复杂的日内交易中取得成功的机会。
指标配置
5.0
评价:1
5 | 100 % | |
4 | 0 % | |
3 | 0 % | |
2 | 0 % | |
1 | 0 % |
客户评价
February 25, 2025
unclear signals stop looking so clean, but it is not the whole trading plan.
cTrader Store 提供的所有产品,包括交易机器人、指标和插件,均由第三方开发者提供,仅供信息参考和技术访问之用。cTrader Store 并非经纪商,不提供投资建议、个人推荐或任何未来业绩保证。
该作者的其他作品


猜您喜欢


15
销售
4.55K
免费安装