
Descripción
¿Cansado de pasar una eternidad marcando tus gráficos? Este indicador lo hace por ti súper rápido.
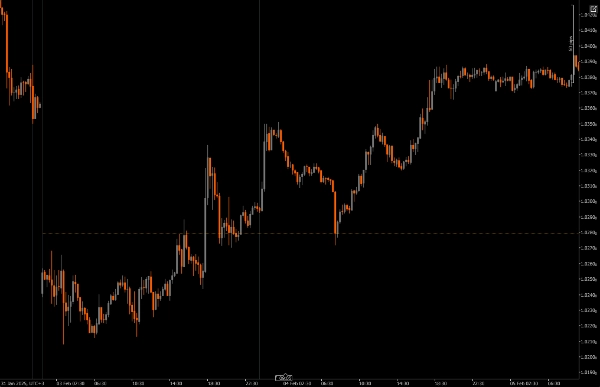
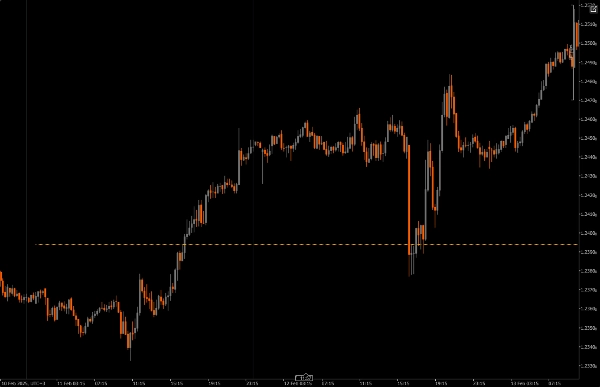
Encuentra el punto medio entre el máximo y mínimo del día anterior, y lo traza en tus gráficos. Ahora puedes escanear tus gráficos súper rápido. ¡Muy fácil!
Algunas características interesantes
Marco de tiempo de referencia personalizable: Puedes elegir un marco de tiempo mínimo y máximo para trazar niveles de precio significativos, lo que ayuda a alinear tus operaciones intradía con las tendencias del mercado más amplias.
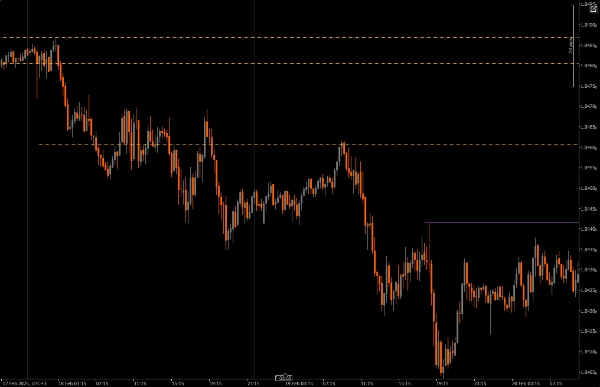
Lo que hace especial a este indicador es la capacidad de seguir la vela semanal a medida que se imprime día a día, facilitando captar la expansión de la vela semanal.
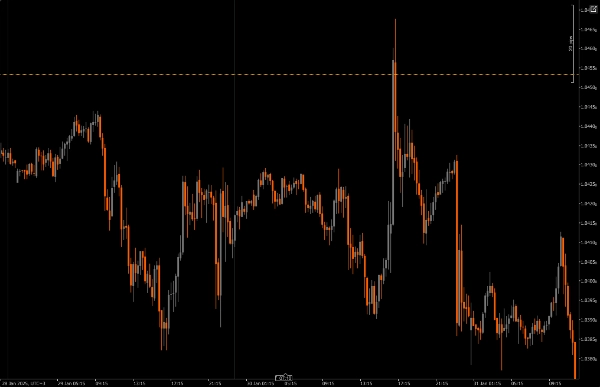
Parámetro de desplazamiento: Esta función te permite decidir hasta qué punto en el futuro se extienden los niveles trazados, dándote una imagen más clara de las posibles zonas de continuación del precio futuro.
Personalización visual: Tienes muchas opciones para ajustar estilos de línea, grosor y colores, facilitando crear un gráfico que se adapte a tu estilo personal y sea fácil de leer.
Restricciones de marco de tiempo: El indicador incluye verificaciones para asegurarse de que solo funcione dentro de los ajustes de marco de tiempo especificados, para que puedas evitar el desorden en el gráfico al cambiar entre otros marcos de tiempo.
Puntos a tener en cuenta:
Un favorito personal
Si eres como yo y no puedes estar sin marcar tus gráficos, entonces prueba este indicador. Tiene restricciones de marco de tiempo y funcionalidad de período de retroceso destinadas a reducir el desorden en el gráfico.
Este indicador es útil para seguir cómo se desarrolla la vela semanal; si la expansión semanal muestra signos de un flujo de órdenes alcista, entonces los niveles pivote en este indicador visualizan áreas o zonas para unirse a la expansión alcista; de manera similar, si la expansión semanal muestra un flujo de órdenes bajista, entonces los niveles pivote en este indicador visualizan áreas o zonas para unirse a la expansión bajista.
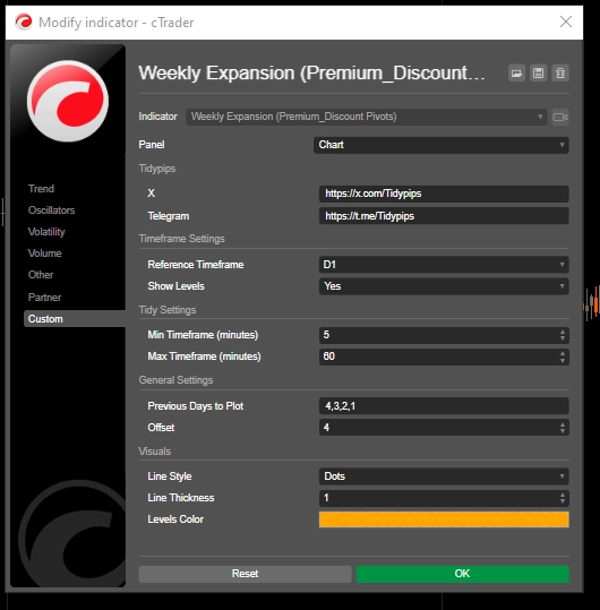
Instalación: Comienza descargando e instalando el Previous Day Equilibrium en tu plataforma cAlgo.
Configuración: Abre los ajustes para elegir tu marco de tiempo de referencia, selecciona cuántos días anteriores quieres trazar y personaliza los ajustes visuales a tu gusto.
Análisis: Mientras operas, mantén un ojo en los niveles trazados en tu gráfico. Estos niveles indican dónde el precio podría revertirse basándose en la acción histórica del precio, ayudándote a tomar decisiones más informadas.
Ejecución: Usa estos niveles para determinar tus puntos de entrada y salida, así como órdenes de stop-loss y take-profit, integrándolos en tu estrategia general de trading.
Herramientas complementarias recomendadas:
cTrader: Esta es la mejor plataforma para usar el Previous Day Equilibrium, proporcionando una experiencia fluida para la personalización y el análisis.
Herramientas de análisis técnico: Combina este indicador con otras herramientas como medias móviles u osciladores para obtener una visión más completa de las tendencias del mercado.
Herramientas de gestión de riesgo: Utiliza calculadoras y herramientas de stop-loss para ayudar a gestionar tu riesgo de manera efectiva mientras operas alrededor de estos niveles clave.
Al usar el Previous Day Equilibrium junto con estas herramientas, puedes mejorar tu estrategia de trading y aumentar tus posibilidades de éxito en el mundo acelerado del trading intradía.
Resumen
Valoraciones de clientes
5 | 0 % | |
4 | 100 % | |
3 | 0 % | |
2 | 0 % | |
1 | 0 % |


