
Descripción
Orden de Clúster de Liquidez (LCO) 🔍💧
1. Qué muestra LCO
Orden de Clúster de Liquidez detecta y dibuja automáticamente:
- Clústeres de liquidez alcistas (zonas potenciales de demanda / acumulación) ✅
- Clústeres de liquidez bajistas (zonas potenciales de oferta / distribución) 🔻
Cada clúster está:
- anclado en una barra pivote de volumen (un máximo local de volumen),
- clasificado como alcista o bajista según la extensión reciente del precio,
- extendido hacia adelante en el tiempo hasta que el precio mitiga (consume) el clúster.
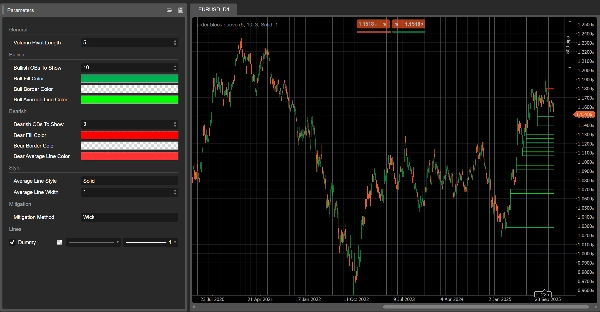
En el gráfico ves:
- Rectángulos verdes → clústeres de liquidez alcistas
- Rectángulos rojos → clústeres de liquidez bajistas
- Una línea gris dentro de cada rectángulo → el nivel de precio promedio de ese clúster
Una vez que un clúster se considera mitigado, desaparece del gráfico y solo permanecen los clústeres activos.
2. Lógica de detección (en términos simples)
- Pivote de volumen
-
- LCO busca barras donde el volumen es mayor que las barras anteriores y siguientes de
Longitud del Pivote de Volumen. - Estas barras son pivotes de volumen – anclas potenciales para los clústeres de liquidez.
- LCO busca barras donde el volumen es mayor que las barras anteriores y siguientes de
- Contexto: alcista vs bajista
-
- El comportamiento reciente del precio define un contexto:
-
- Contexto alcista → la extensión a la baja ha dominado.
- Contexto bajista → la extensión al alza ha dominado.
- Este contexto decide si el próximo pivote de volumen creará un clúster de liquidez alcista o bajista.
- Clúster de liquidez alcista
En un contexto alcista: -
- Fondo del clúster = mínimo de la barra pivote
- Tope del clúster = punto medio de la barra (
(alto + bajo) / 2) - Interpretación: zona donde se absorbió la presión a la baja y los compradores intervinieron agresivamente.
- Clúster de liquidez bajista
En un contexto bajista: -
- Fondo del clúster = punto medio de la barra pivote
- Tope del clúster = máximo de la barra pivote
- Interpretación: zona donde se absorbió la presión al alza y los vendedores tomaron el control.
- Línea promedio
-
- Para cada clúster, LCO calcula la media del tope y fondo y dibuja una línea media gris.
- Esto actúa como un nivel de equilibrio interno del clúster.
- Mitigación (consumo del clúster)
En cada nueva barra, LCO verifica si un clúster está mitigado: -
- Para clústeres alcistas:
-
- Rastrea un precio objetivo a la baja durante las últimas
Longitud del Pivote de Volumenbarras: -
Método de Mitigación = Mecha→ mínimo mínimo.Método de Mitigación = Cierre→ cierre más bajo.
- Si este precio objetivo baja por debajo del fondo del clúster, el clúster alcista se considera mitigado y se elimina.
- Rastrea un precio objetivo a la baja durante las últimas
- Para clústeres bajistas:
-
- Rastrea un precio objetivo al alza:
-
Mecha→ máximo máximo.Cierre→ cierre más alto.
- Si este precio objetivo sube por encima del tope del clúster, el clúster bajista está mitigado y se elimina.
Mitigado = se asume que la liquidez en ese clúster está consumida / invalidada.
3. Cómo leer LCO en el gráfico
Verás principalmente:
- Clústeres verdes debajo del precio → zonas potenciales de liquidez de demanda
- Clústeres rojos encima del precio → zonas potenciales de liquidez de oferta
Lectura típica (no es consejo de trading):
- Clústeres recientes
-
- Los clústeres creados recientemente suelen ser más relevantes:
-
- Clúster alcista debajo del precio → área donde los compradores absorbieron por última vez la presión de venta.
- Clúster bajista encima del precio → área donde los vendedores absorbieron por última vez la presión de compra.
- Retests de un clúster
-
- El precio regresa a un clúster alcista desde arriba:
-
- Si el precio reacciona y sostiene el fondo → posible rebote / zona de reacción larga.
- El precio regresa a un clúster bajista desde abajo:
-
- Si el precio no logra superar el tope → posible rechazo / zona de reacción corta.
- Clústeres mitigados vs activos
-
- Cuando el precio atraviesa un clúster más allá de sus límites según el método de mitigación elegido,
→ ese clúster de liquidez es eliminado en las barras siguientes. - Los clústeres aún visibles son zonas de liquidez activas que aún no han sido completamente negociadas.
- Cuando el precio atraviesa un clúster más allá de sus límites según el método de mitigación elegido,
- Uso de la línea media
-
- Esa línea media gris puede usarse como:
-
- un nivel para tomar ganancias o salida parcial dentro del clúster,
- una referencia de “precio justo” dentro de la zona de liquidez,
- una forma rápida de ver si el precio está operando en la mitad superior o inferior del clúster.
4. Parámetros (Inglés)
Longitud del Pivote de Volumen
- Barras usadas para:
-
- detectar pivotes de volumen,
- calcular extremos y objetivo de mitigación.
- Valores bajos → más clústeres, más ruido;
- Valores altos → menos clústeres, más significativos.
Clústeres de Liquidez Alcistas a Mostrar
(antes OBs Alcistas a Mostrar)
- Número máximo de clústeres alcistas mostrados en el gráfico.
Clústeres de Liquidez Bajistas a Mostrar
(antes OBs Bajistas a Mostrar)
- Número máximo de clústeres bajistas mostrados.
Color de Relleno Alcista / Color de Relleno Bajista
- Color de relleno de los clústeres alcistas/bajistas.
- Puedes incluir valores alfa (opacidad).
Color de la Línea Promedio Alcista/Bajista
- Color de la línea media interna para cada clúster.
Estilo de la Línea Promedio
- Estilo visual para la línea media:
"Sólido","Discontinuo","Punteado".
Ancho de la Línea Promedio
- Grosor de la línea media.
Método de Mitigación
"Mecha"→ mitigación basada en mechas altas/bajas (más sensible)."Cierre"→ mitigación basada en precios de cierre (más conservador).
Resumen
On the chart, bullish clusters appear as green rectangles below the price, indicating areas where buyers absorbed selling pressure. Bearish clusters are shown as red rectangles above the price, marking zones where sellers absorbed buying pressure. Each cluster includes a grey mid-line representing the average price level, serving as an internal equilibrium reference.
Clusters extend forward in time until price "mitigates" or consumes them, at which point they disappear, leaving only active liquidity zones visible. Mitigation is determined by tracking price extremes (high/low wicks or closing prices) over a configurable number of bars.
Key parameters include the volume pivot length (defining sensitivity and cluster significance), maximum clusters displayed, cluster colors, mid-line style, and mitigation method. LCO supports various markets including forex, indices, commodities, stocks, and cryptocurrencies, and integrates with multiple trading strategies and indicators such as RSI, MACD, Bollinger Bands, and Fibonacci levels.
Valoraciones de clientes
5 | 100 % | |
4 | 0 % | |
3 | 0 % | |
2 | 0 % | |
1 | 0 % |


![Logotipo de "[Stellar Strategies] Market Session Ultimate"](https://cdn.ctrader.com/image/webp/61ffd537-0125-4246-9e72-42eca1791d64_28232)


