Deskripsi
Momentum Pembelajaran Mesin KNN Berhenti tertinggal. Mulailah memprediksi. Analitik K-Nearest Neighbors tingkat institusional.
Parameter default dioptimalkan untuk XAUUSD. Bekerja pada timeframe apa pun — pilih berdasarkan gaya trading Anda. Timeframe yang lebih tinggi memberikan sinyal yang lebih bersih dan probabilitas lebih tinggi. Timeframe yang lebih rendah menghasilkan lebih banyak sinyal dengan sedikit lebih banyak noise. Lihat Panduan Timeframe di bawah.
🥈 Juga Tersedia: Versi Bot Otomatis XAGUSD Suka logikanya? Bawa lebih jauh. Versi bot khusus dari indikator ini — disesuaikan secara khusus untuk XAGUSD (Perak) — tersedia di marketplace. Berjalan sepenuhnya otomatis, mengeksekusi perdagangan atas nama Anda tanpa input manual. Harga rendah relatif terhadap ROI yang dirancang untuk diberikan.
👉 KNN XAGUSD Bot — Lihat di Pasar cTrader
⏱ Panduan Timeframe
TimeframeVolume SinyalCatatan
M5
Sangat Tinggi
Lebih banyak noise — membutuhkan disiplin dan penyaringan yang lebih ketat untuk menghindari overtrading.
M8
Tinggi (DEFAULT)
Baseline yang dioptimalkan. Keseimbangan terbaik antara frekuensi sinyal dan akurasi untuk XAUUSD.
M15
Sedang
Sinyal yang lebih bersih dan berkualitas tinggi dengan lebih sedikit entri per sesi.
M30 / H1
Rendah
Akurasi tertinggi — paling cocok untuk pengaturan gaya swing dengan kesabaran lebih diperlukan.
Parameter default diuji ulang pada M8. Jika Anda mengganti timeframe, pertimbangkan untuk menyesuaikan Periode ATR dan pengali SL/TP sesuai.
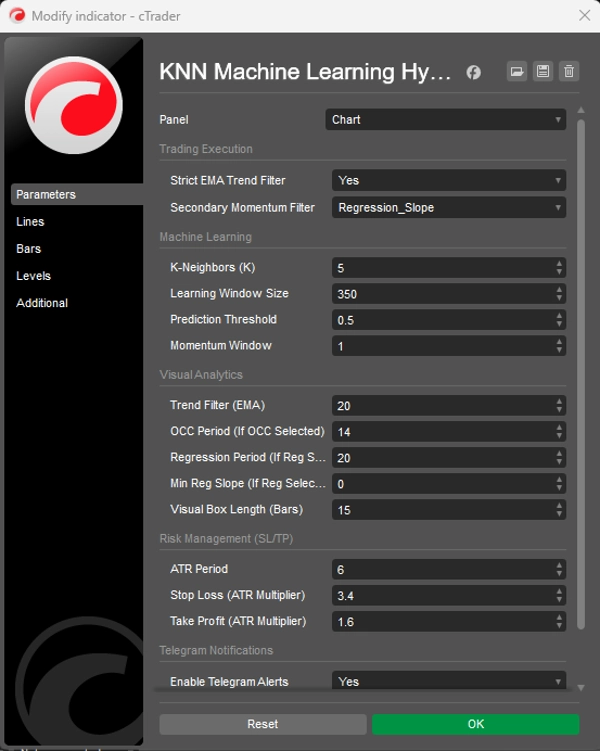
⚙️ Parameter Default
Jendela Pembelajaran (350) — Jumlah candle historis yang dipindai mesin KNN untuk pencocokan pola.
Ambang Prediksi (0.5) — Skor kepercayaan minimum yang diperlukan sebelum sinyal dihasilkan.
Periode ATR (6) — Periode yang digunakan untuk menghitung Average True Range untuk ukuran SL/TP.
Pengali Stop Loss (3.4) — Jarak SL = ATR × 3.4. Lebih lebar untuk memberi ruang volatilitas Emas bernapas.
Pengali Take Profit (1.6) — Jarak TP = ATR × 1.6. Lebih ketat untuk mengunci keuntungan dengan cepat dan mempertahankan tingkat kemenangan tinggi.
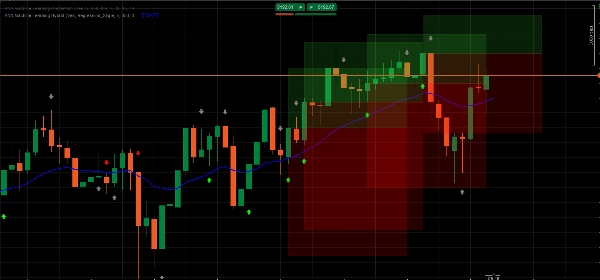
Filter Tren EMA (20) — Periode EMA yang digunakan sebagai filter tren — Garis Biru pada grafik Anda.
🤖 Mesin KNN Prediktif Mengompres deviasi RSI dan MA menjadi algoritma pencocokan historis. Pada setiap candle, memindai 350 bar terakhir dan menemukan 5 momen masa lalu yang paling mirip untuk memprediksi arah.
📈 Filter Tren EMA Ketat Menekan pengaturan counter-trend dengan probabilitas rendah secara otomatis. Hanya sinyal yang sejalan dengan tren yang lebih luas yang ditandai sebagai probabilitas tinggi.
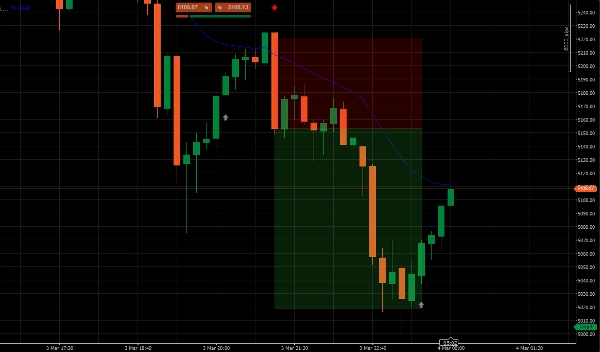
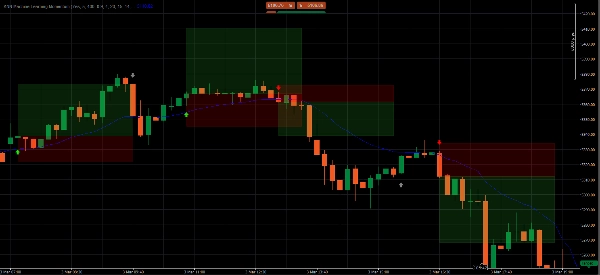
📦 Zona Target ATR Dinamis Memproyeksikan kotak berwarna transparan untuk zona Take Profit dan Stop Loss Anda, menyesuaikan secara real-time dengan volatilitas pasar saat ini melalui ATR.
🧹 Pengelola Memori UI Menjaga grafik Anda tetap bersih dengan secara otomatis menghapus zona lama. Hanya 5 pengaturan terbaru yang ditampilkan kapan saja.
📲 Pemberitahuan Push Telegram Integrasi webhook bawaan mengirimkan peringatan perdagangan instan dengan harga Entry, TP, dan SL yang tepat langsung ke ponsel Anda.
📊 Membaca Sinyal
🟢 Panah Hijau Terang — BELI Probabilitas Tinggi KNN memprediksi harga akan naik DAN harga berada di atas EMA. Keselarasan tren penuh. Ini adalah pengaturan premium untuk diperdagangkan.
🔴 Panah Merah Terang — JUAL Probabilitas Tinggi KNN memprediksi harga akan turun DAN harga berada di bawah EMA. Keselarasan tren penuh. Masuk pada penutupan candle sinyal.
⚪ Panah Abu-abu — Counter-Trend (JANGAN DIPERDAGANGKAN) Pergeseran momentum terdeteksi, tetapi melawan tren yang lebih luas. Dicetak hanya untuk kesadaran — probabilitas jauh lebih rendah.
▶️ Panduan Eksekusi
- Tunggu Panah Hijau Terang atau Merah Terang — abaikan sinyal abu-abu sepenuhnya.
- Tunggu candle sinyal benar-benar tertutup sebelum masuk.
- Setel SL dan TP di tepi horizontal luar setiap kotak — tepi yang paling jauh dari harga masuk Anda.
❓ FAQ
Mengapa panah muncul? Setiap candle, algoritma mengambil snapshot momentum RSI dan MA saat ini, memindai 350 bar terakhir untuk 5 momen yang paling mirip secara matematis, dan memprediksi arah berdasarkan ke mana harga bergerak dari momen-momen tersebut.
Apa yang membuat panah menjadi Terang vs Abu-abu? Panah terang = sinyal AI dan tren EMA sepenuhnya sejalan — probabilitas tertinggi. Panah abu-abu = momentum terdeteksi tetapi counter-trend — ditandai sebagai terlalu berisiko untuk diperdagangkan.
Timeframe mana yang harus saya gunakan? M8 adalah default yang dioptimalkan. Timeframe yang lebih tinggi (M15, M30, H1) memberikan sinyal lebih sedikit tetapi lebih bersih. M5 memberikan lebih banyak sinyal tetapi membutuhkan disiplin penyaringan yang lebih tajam.
Di mana tepatnya saya menempatkan SL dan TP? Di tepi horizontal luar setiap kotak berwarna — tepi yang paling jauh dari harga masuk Anda.
Bisakah saya menggunakan ini pada aset selain Emas? Ya — berlaku untuk aset apa pun di cTrader. Namun, parameter diuji ulang secara khusus untuk XAUUSD. Instrumen lain akan mendapat manfaat dari periode penyetelan parameter.
⚠️ Penafian Risiko Perdagangan valuta asing, komoditas, dan CFD dengan margin membawa tingkat risiko tinggi dan mungkin tidak cocok untuk semua investor. Indikator ini adalah alat analisis kuantitatif untuk tujuan edukasi dan informasi saja — ini bukan merupakan nasihat keuangan. Kinerja masa lalu tidak menunjukkan hasil di masa depan. Selalu uji pada akun demo sebelum mempertaruhkan modal nyata.
Ringkasan
Key functionalities include dynamic Average True Range (ATR)-based stop loss and take profit target zones that adapt to market volatility, and a UI memory manager that keeps charts clear by displaying only the five most recent setups. Signals are visually represented by arrows: bright green for high-probability buy, bright red for high-probability sell, and gray for counter-trend momentum (not recommended for trading). The indicator supports multiple timeframes, with M8 as the default optimized setting balancing signal frequency and accuracy.
Additionally, it integrates Telegram push alerts via webhook, delivering real-time trade signals with precise entry, stop loss, and take profit levels. Users are advised to wait for signal candle closure before entering trades and to place stops and targets at the edges of the ATR target zones. Parameters such as learning window, prediction threshold, ATR period, and multipliers for stop loss and take profit are configurable to suit different trading styles.


![Logo "High-Low Divergence [Iridio Capital]"](https://cdn.ctrader.com/image/webp/443c4661-7abb-40f1-842f-4b6ec560649b_40914)