
Deskripsi
Bawa trading Anda ke tingkat berikutnya dengan Nadaraya-Watson Envelope, versi paling canggih dari indikator Nadaraya-Watson untuk cTrader. Dibangun di atas dasar yang terbukti dari Combined Indicator, rilis yang ditingkatkan ini menghadirkan dukungan peringatan penuh, kustomisasi lebih dalam, dan pengalaman trading yang lebih halus — baik Anda sedang scalping pergerakan cepat atau mengikuti tren jangka panjang.
Fitur Utama
Tiga Mode Trading: Pilih pengaturan yang sempurna untuk strategi Anda:
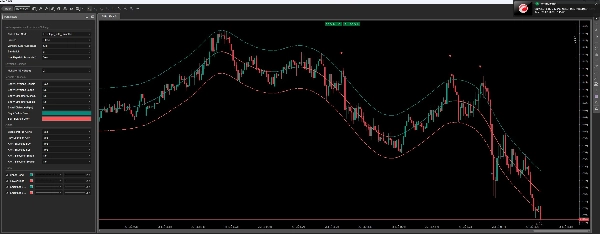
- Envelope + Smoother — menggabungkan pita harga dan garis tren yang halus untuk pandangan pasar yang lengkap.
- Envelope Only — menyoroti level harga kunci untuk menangkap pembalikan atau breakout.
- Smoother Only — mengikuti tren harga yang halus untuk mengikuti arah pasar.
Sistem Peringatan Lengkap: Jangan pernah melewatkan sinyal lagi. Dapatkan notifikasi pop-up dan peringatan suara seketika saat sinyal muncul — dapat dikonfigurasi secara terpisah untuk sinyal Buy/Sell Envelope dan Bullish/Bearish Smoother.
Warna Sinyal Kustom: Personalisasi grafik Anda dengan pemilih warna bawaan untuk sinyal Buy/Bullish dan Sell/Bearish — tanpa perlu coding.
Jendela Lookback yang Dapat Dikustomisasi: Sesuaikan Ukuran Jendela (50–2000 bar, default 500) untuk mengatur seberapa banyak data historis yang digunakan indikator — memberi Anda kontrol penuh atas sensitivitas dan performa.
Opsi Sinyal Fleksibel: Tampilkan atau sembunyikan sinyal beli/jual untuk mode Envelope dan Smoother secara independen.
Label yang Dapat Disesuaikan: Tambahkan atau hapus label teks "Buy" dan "Sell" untuk menjaga grafik Anda tetap bersih atau detail sesuai keinginan.
Sinyal Real-Time atau Terkonfirmasi: Beralih antara pembaruan real-time yang dapat dicat ulang atau sinyal stabil, terkonfirmasi, dan tidak dicat ulang untuk menyesuaikan toleransi risiko Anda.
Tampilan Grafik Bersih: Secara otomatis menghapus sinyal usang untuk menjaga grafik Anda bebas dari kekacauan dan mudah dibaca.
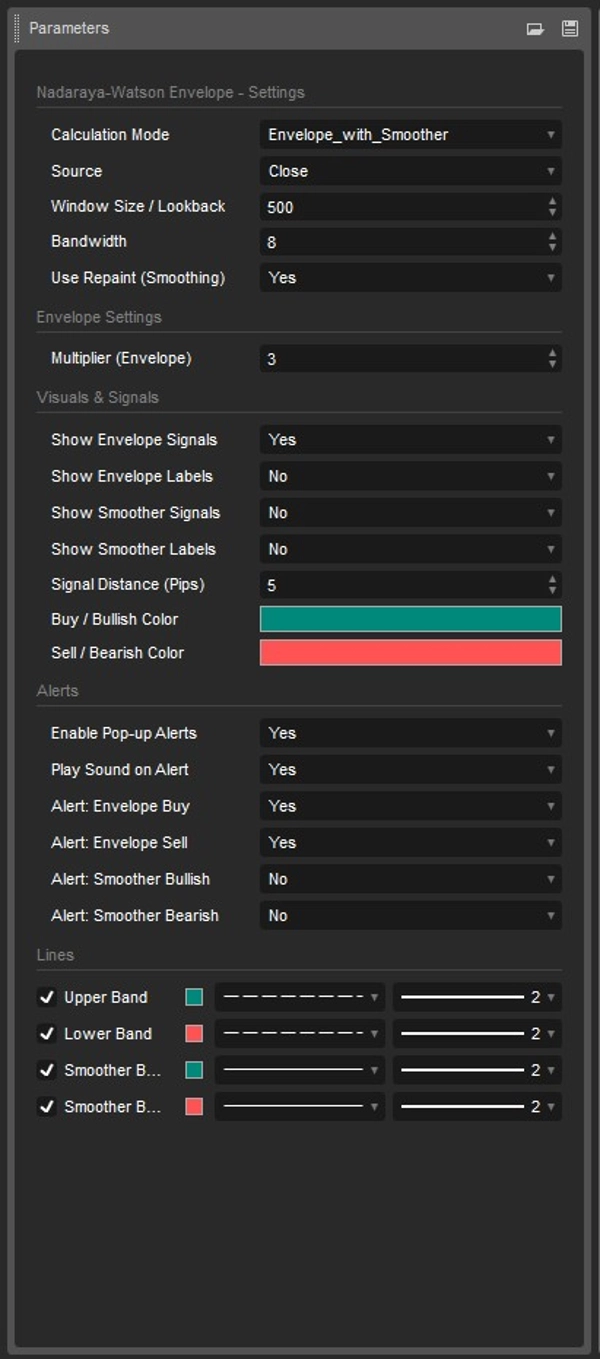
Opsi Kustomisasi
- Pemilihan Mode — Envelope + Smoother, Envelope, atau Smoother
- Ukuran Jendela — lookback yang dapat dikonfigurasi dari 50 hingga 2000 bar
- Bandwidth & Multiplier — sesuaikan sensitivitas indikator dan lebar envelope
- Warna Sinyal — pemilih warna terpisah untuk sinyal bullish dan bearish
- Kontrol Sinyal — aktifkan/nonaktifkan sinyal per tipe (Envelope / Smoother)
- Kontrol Label — tampilkan atau sembunyikan label teks per tipe sinyal
- Penempatan Sinyal — atur jarak dari bar harga dalam pips
- Kontrol Peringatan — aktifkan/nonaktifkan popup dan suara per tipe sinyal secara individual
- Semua dari v1.1, sepenuhnya dipertahankan dan ditingkatkan
- Peringatan — fitur yang paling banyak diminta, sekarang sepenuhnya diimplementasikan
- Kustomisasi Warna — buat indikator benar-benar milik Anda
- Ukuran jendela dinamis — beradaptasi dengan pasar atau timeframe apa pun secara instan
- Kontrol lebih banyak, kekacauan lebih sedikit — pengaturan granular tanpa kompleksitas
Ideal Untuk
- Pengikut Tren — mengikuti momentum dengan garis tren yang halus
- Trader Pembalikan — menangkap titik balik dengan sinyal pita envelope
- Trader Berbasis Peringatan — biarkan indikator memberi tahu Anda saat Anda fokus di tempat lain
- Semua Tingkat Pengalaman — cukup sederhana untuk pemula, cukup kuat untuk profesional
Ringkasan
The indicator supports a configurable lookback window (50–2000 bars) to adjust sensitivity and performance. It provides real-time or confirmed (non-repainting) signals, with an automatic cleanup feature that removes outdated signals to maintain chart clarity. A full alert system delivers pop-up notifications and sound alerts for each signal type, helping traders stay informed.
Customization options include mode selection, bandwidth and multiplier adjustments, signal placement distance from price bars, and granular control over alerts and labels. The indicator suits trend followers, reversal traders, alert-driven traders, and traders of all experience levels, supporting markets such as Forex, indices, commodities, stocks, and cryptocurrencies.
Ulasan pelanggan
5 | 100 % | |
4 | 0 % | |
3 | 0 % | |
2 | 0 % | |
1 | 0 % |


