
Deskripsi
Tampilan:
Indikator Supertrend – alat penting bagi para trader yang memudahkan untuk mengikuti tren pasar dan membuat keputusan investasi yang lebih cerdas! Indikator profesional dan intuitif ini dirancang untuk memberikan sinyal beli dan jual yang sangat jelas, baik Anda baru memulai maupun sudah menjadi investor berpengalaman.
Mengapa Memilih Indikator Supertrend?
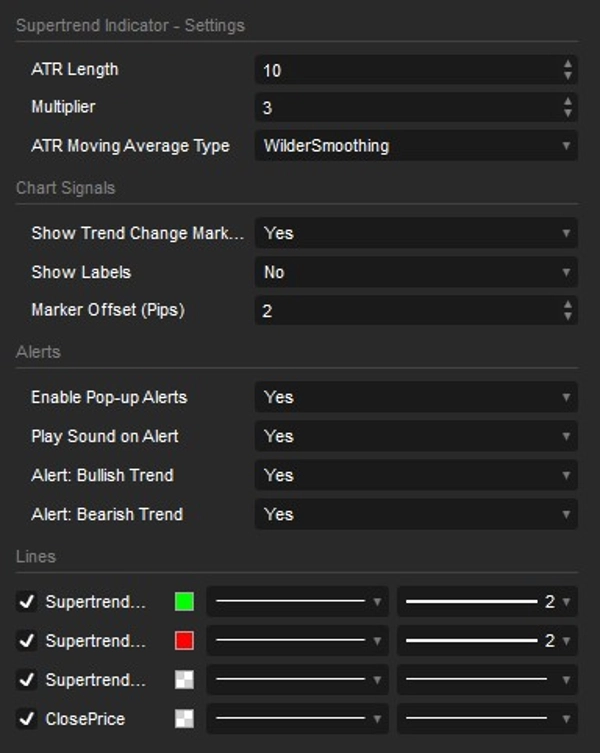
- Akurasi Standar Industri: Sekarang menampilkan Jenis Rata-Rata Bergerak ATR yang dapat disesuaikan (termasuk Wilder's Smoothing). Ini menghitung dan merespons persis seperti versi Supertrend premium paling populer yang ditemukan di platform charting teratas seperti TradingView!
- 100% Tidak Melukis Ulang: Dibangun dengan mekanisme memori tren yang sangat kuat. Setelah tren berubah dan sinyal tercetak, sinyal tersebut tetap ada. Tidak ada pelukisan ulang, tidak ada panah yang hilang, dan tidak ada kesalahan perhitungan ulang saat menggulir riwayat grafik.
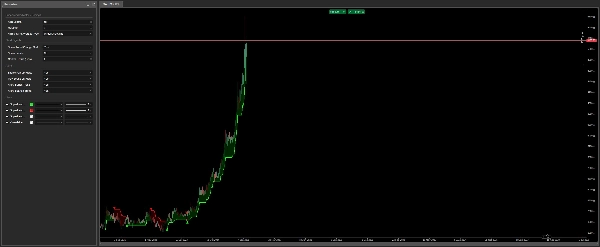
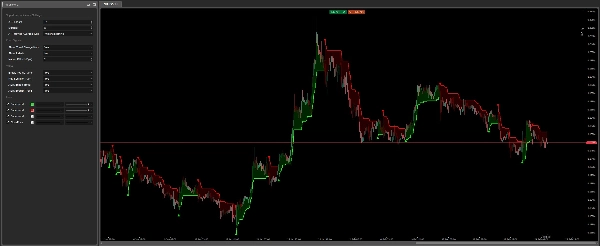
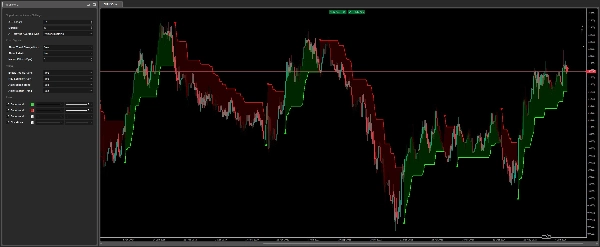
- Kesederhanaan dan Efektivitas: Indikator secara otomatis menggambar garis Supertrend yang berubah menjadi hijau saat pasar naik (sinyal beli) dan merah saat turun (sinyal jual). Anda akan selalu tahu dengan tepat ke arah mana tren bergerak.
- Notifikasi Real-Time Cerdas: Jangan pernah melewatkan peluang trading! Indikator ini memiliki sistem peringatan yang ditingkatkan menggunakan Pop-up cTrader asli dan efek suara terintegrasi. Selain itu, dengan perlindungan spam bawaan, Anda hanya diberi tahu sekali saat sinyal real-time terjadi—tidak ada spam suara yang mengganggu saat memuat atau memuat ulang grafik.
- Sinyal Visual & Pengisian Awan yang Ditingkatkan: Pada setiap perubahan tren utama, Anda akan melihat panah mencolok dan label teks opsional "Bullish"/"Bearish". Pengisian awan yang halus dan dinamis antara garis Supertrend dan harga membantu Anda dengan mudah memahami momentum pasar sekilas.
- Sepenuhnya Dapat Disesuaikan & Presisi: Mudah menyesuaikan pengaturan inti seperti Panjang ATR dan Pengali. Anda juga dapat mengontrol jarak panah dan label secara tepat menggunakan offset berbasis Pip dinamis, memastikan visual yang sempurna dan tidak berantakan pada aset apa pun.
Indikator Supertrend sangat cocok untuk siapa saja yang ingin menyederhanakan analisis pasar – dari trader pemula yang mencari cara mudah untuk mengenali tren, hingga profesional berpengalaman yang menginginkan sinyal yang sangat presisi dan tidak melukis ulang untuk strategi mereka. Ini bekerja dengan sempurna di pasar mana pun – Forex, Saham, Indeks, Cryptocurrency – dan di semua kerangka waktu.
Ringkasan
Ulasan pelanggan
5 | 33 % | |
4 | 67 % | |
3 | 0 % | |
2 | 0 % | |
1 | 0 % |


