
Deskripsi
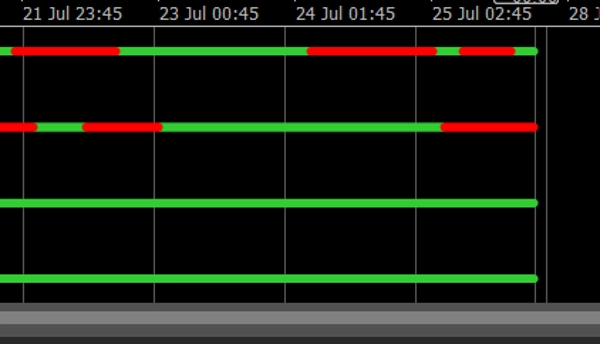
Multi Timeframe Trend Dots adalah indikator tren yang kuat dan minimalis yang dibuat untuk cTrader. Ini memungkinkan para trader untuk melacak arah tren secara visual di hingga 4 kerangka waktu yang dapat dipilih menggunakan garis titik berwarna sederhana namun efektif.
✅ Hijau = Tren naik
✅ Merah = Tren turun
✅ Tata letak bersih dalam satu sub-jendela
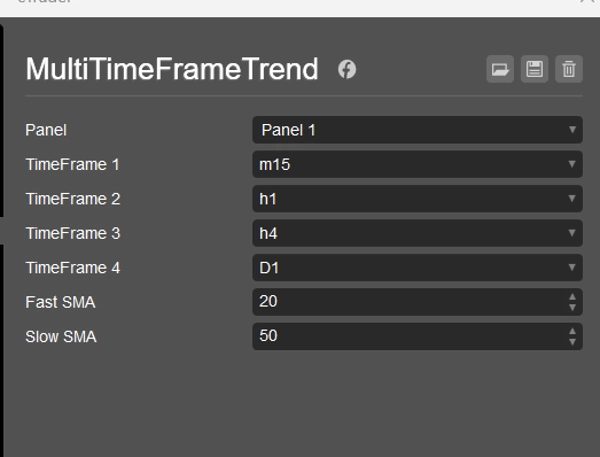
✅ Dapat disesuaikan pengaturan SMA cepat/lambat
✅ Bekerja pada simbol dan kerangka waktu apa pun
Apakah Anda seorang scalper, trader intraday, atau trader swing, indikator ini memberi Anda pandangan cepat tentang penyelarasan multi-kerangka waktu — ideal untuk membuat entri yang percaya diri atau menyaring setup yang buruk.
💼 Termasuk:
- Logika tren berdasarkan crossover SMA
- Penempatan titik 4 level (disesuaikan untuk keterbacaan)
- Label kerangka waktu di akhir setiap garis tren
- Sepenuhnya kompatibel dengan semua versi cTrader
🎁 Pendamping sempurna untuk membangun strategi atau trading manual.
Ringkasan
Ulasan pelanggan
5 | 0 % | |
4 | 100 % | |
3 | 0 % | |
2 | 0 % | |
1 | 0 % |


