
RsiMultiFrameOBOS
Indikator
Versi 1.0, Oct 2025
Windows, Mac
4.0
Ulasan: 1
Deskripsi
Deskripsi:
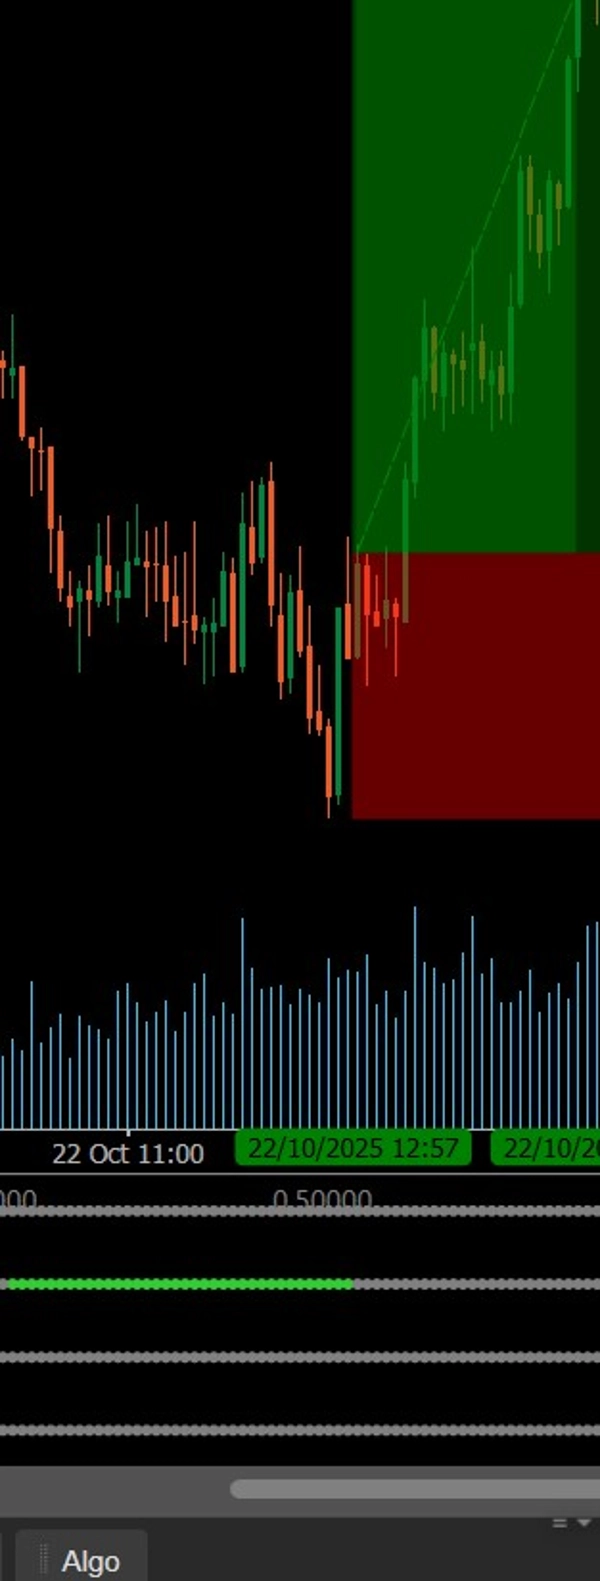
Indikator ini memvisualisasikan tren RSI di empat kerangka waktu yang dapat disesuaikan menggunakan titik berwarna (hijau untuk jenuh jual, merah untuk jenuh beli, abu-abu untuk netral). Ini membantu trader menilai keselarasan momentum pasar secara instan dan mengidentifikasi konfirmasi RSI multi-kerangka waktu untuk entri yang lebih kuat.
Ringkasan
Profil indikator
Ulasan pelanggan
4.0
Ulasan: 1
5 | 0 % | |
4 | 100 % | |
3 | 0 % | |
2 | 0 % | |
1 | 0 % |
Ulasan pelanggan
November 8, 2025
A few signals across sessions tell more, and the review screen feels calmer.
Diskusi
Pertanyaan umum
BTCUSD
Prop
Forex
Scalping
Indices
EURUSD
Commodities
RSI
Crypto
Stocks
XAUUSD
Martingale
Produk-produk yang tersedia melalui cTrader Store, termasuk bot trading, indikator, dan plugin, disediakan oleh pengembang pihak ketiga serta hanya ditujukan untuk akses teknis dan informasi. cTrader Store bukan broker dan tidak menyediakan saran investasi, rekomendasi pribadi, atau jaminan apa pun tentang kinerja di masa mendatang.
Produk lain dari penulis ini


Harga
Sejak 21/01/2025
3
Penjualan