
Deskripsi
VWAP (Volume Weighted Average Price) adalah tolok ukur perdagangan yang menghitung harga rata-rata dari suatu aset yang disesuaikan dengan volume perdagangan selama periode tertentu. Ini banyak digunakan oleh pedagang harian, institusi, dan sistem perdagangan algoritmik untuk menilai nilai wajar dan mengoptimalkan pelaksanaan perdagangan.
Rumus Utama:
VWAP=∑(Price×Volume)/∑Volume
- Harga = Harga tipikal (Tinggi + Rendah + Penutupan) / 3 atau hanya harga Penutupan.
- Volume = Volume perdagangan untuk setiap periode.
2. Mengapa Menggunakan VWAP?
Tujuan:
1)Referensi Nilai Wajar
Harga > VWAP = Bias bullish; Harga < VWAP = Bias bearish.
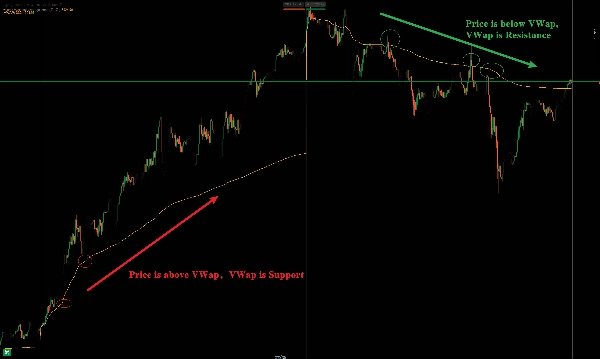
2)Dukungan/Resistensi Dinamis
Bertindak sebagai level kunci untuk breakout/reversal intraday.
3) Konfirmasi Tren
Harga bertahan di atas VWAP = Tren naik; Di bawah = Tren turun.
Penjelasan dan Penggunaan Indikator Volume Weighted Average Price (VWAP)
1. Konsep Dasar
VWAP(成交量加权平均价) adalah alat analisis teknikal yang digunakan untuk mengukur harga rata-rata perdagangan suatu aset selama periode waktu tertentu, dan dihitung dengan pembobotan berdasarkan volume perdagangan. Ini membantu pedagang menilai harga saat ini relatif terhadap "nilai wajar" pasar, sering digunakan dalam perdagangan harian, perdagangan algoritmik, dan pelaksanaan pesanan institusional.
Rumus Inti:
VWAP=∑(Price×Volume)/∑Volume
Harga setiap candlestick × volume perdagangan dijumlahkan, kemudian dibagi dengan total volume perdagangan, menghasilkan harga rata-rata tertimbang dinamis.
2. Penggunaan Utama VWAP
Penggunaan:
1)Menilai Harga Pasar yang Wajar
Harga di atas VWAP = Kuat; di bawah VWAP = Lemah.
2)Referensi Dukungan/Resistensi
VWAP sering digunakan sebagai level dukungan/resistensi dinamis untuk perdagangan jangka pendek.
3)Konfirmasi Tren Intraday
Harga terus berada di atas VWAP = Dominasi bullish; di bawah = Dominasi bearish.
Ringkasan
VWAP serves several key functions: it acts as a reference for fair value, where prices above VWAP indicate bullish bias and below indicate bearish bias; it provides dynamic support and resistance levels useful for intraday breakouts and reversals; and it helps confirm intraday trends, with prices sustained above VWAP signaling an uptrend and below signaling a downtrend.
This indicator supports various markets including forex, stocks, indices, commodities, and cryptocurrencies, making it a versatile tool for intraday market analysis and trading strategy development.


