
session indicator
Indikator
7 pembelian
Versi 1.0, May 2025
Windows, Mac
4.3
Ulasan: 3
Deskripsi
Visualisasikan Sesi Pasar Utama + Level Tertinggi/Rendah dengan Presisi
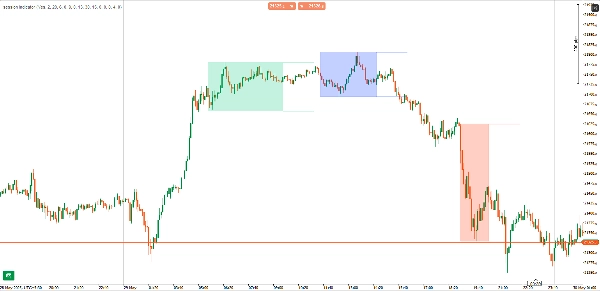
Indikator Sesi Perdagangan menyoroti sesi perdagangan paling penting — London, New York, dan Tokyo — langsung di grafik Anda. Baik Anda seorang scalper atau trader swing, mengetahui kapan volatilitas meningkat atau menurun sangat penting. Alat ini memberikan keunggulan itu dengan kejelasan.
✅ Fitur Utama:
- Persegi Sesi: Sorot setiap sesi secara visual dengan kotak bayangan opsional
- Garis Tertinggi/Rendah: Plot tertinggi dan terendah sesi dengan panjang ekstensi yang dapat disesuaikan
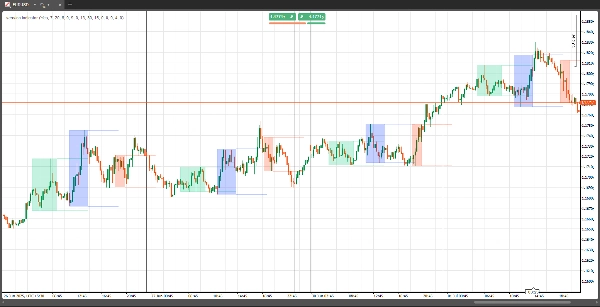
- Tampilan Historis: Lihat data sesi untuk hari ini atau sejumlah hari sebelumnya
- Sepenuhnya Dapat Disesuaikan: Atur waktu mulai/akhir sesi, aktifkan/nonaktifkan persegi, dan tentukan seberapa jauh garis diperpanjang
- Dukungan Multi Timeframe: Bekerja pada semua timeframe grafik
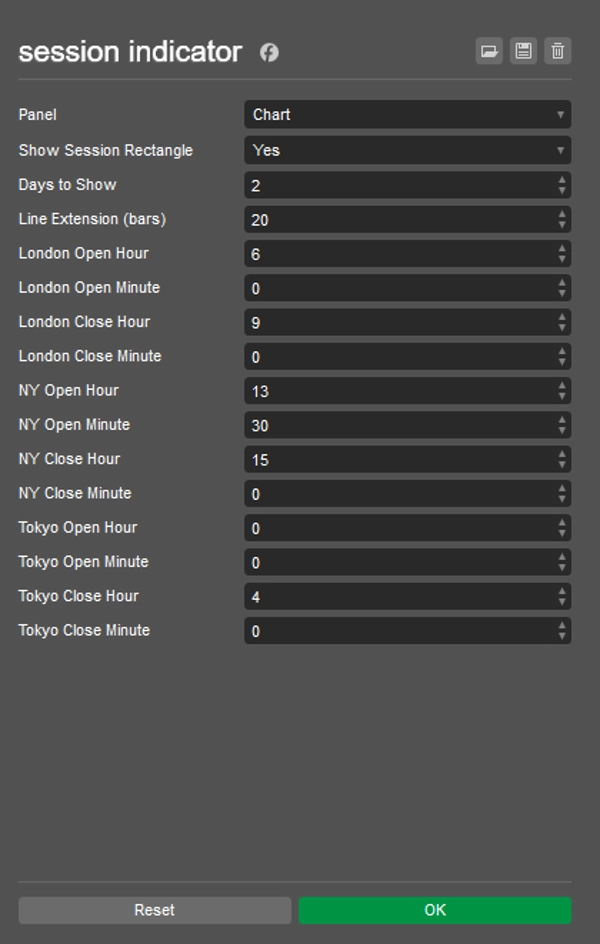
🔧 Parameter:
- Waktu Sesi: Waktu mulai/akhir khusus untuk London, NY, dan Tokyo
- Tampilkan Persegi: Aktifkan kotak sesi yang diberi bayangan
- Hari yang Ditampilkan: Jumlah hari historis untuk menampilkan data sesi
- Batang Perpanjangan Garis: Kontrol seberapa jauh garis tertinggi/rendah sesi diperpanjang di grafik
🧠 Mengapa Menggunakannya?
Memahami pola volatilitas berbasis sesi adalah dasar dari perdagangan institusional. Indikator ini membantu Anda:
- Menentukan waktu masuk dan keluar di sekitar zona likuiditas utama
- Mengidentifikasi tertinggi dan terendah sesi untuk strategi breakout atau pembalikan
- Memisahkan secara visual tumpang tindih sesi (misalnya, London–NY)
Ringkasan
Ringkasan AI
The Session Indicator is a charting tool designed to highlight key global trading sessions—London, New York, and Tokyo—directly on trading charts. It visually marks each session with optional shaded rectangles and plots session high and low price levels, with customizable line extension lengths. Users can view session data for the current day or multiple previous days, supporting analysis across various timeframes.
Key features include full customization of session start and end times, toggling of session rectangles, and control over how far high/low lines extend. The indicator works on all chart timeframes and helps traders identify volatility patterns associated with institutional trading sessions.
This tool aids in timing entries and exits around key liquidity zones, recognizing session highs and lows for breakout or reversal strategies, and visually distinguishing overlapping sessions such as London-New York. It supports markets including Forex, indices, and major symbols like NAS100. The indicator outputs visual signals based on market structure concepts and is suitable for traders employing reversal strategies.
Profil indikator
Kategori indikator
Struktur pasar (SMC)
Tipe output
Visualisasi
Persyaratan data
Hanya batang
Sinyal yang didukung
Reversal
Ulasan pelanggan
4.3
Ulasan: 3
5 | 67 % | |
4 | 0 % | |
3 | 33 % | |
2 | 0 % | |
1 | 0 % |
Ulasan pelanggan
June 2, 2025
Useful setup helper for traders who care about timing windows. It gives value around session timing, but the value depends on the trader's schedule. I would compare Asia range, London break and New York continuation before trusting it. The tool is most useful when it keeps the trader out of dead hours.
June 1, 2025
June 1, 2025
Decent trade support for session timing. it helps match setups with active market hours, especially when used for planning trades around active sessions. The session view is useful for London and New York, especially when checking the first 60 minutes. The tool is most useful when it keeps the trader out of dead hours.
Diskusi
Pertanyaan umum
Prop
Forex
Indices
Fair Value Gap
SMC
NAS100
Produk-produk yang tersedia melalui cTrader Store, termasuk bot trading, indikator, dan plugin, disediakan oleh pengembang pihak ketiga serta hanya ditujukan untuk akses teknis dan informasi. cTrader Store bukan broker dan tidak menyediakan saran investasi, rekomendasi pribadi, atau jaminan apa pun tentang kinerja di masa mendatang.


Harga
Sejak 30/05/2025
40
Penjualan