الوصف
🚀 مؤشر HALF TREND - النظام النهائي لمتابعة الاتجاه 🚀
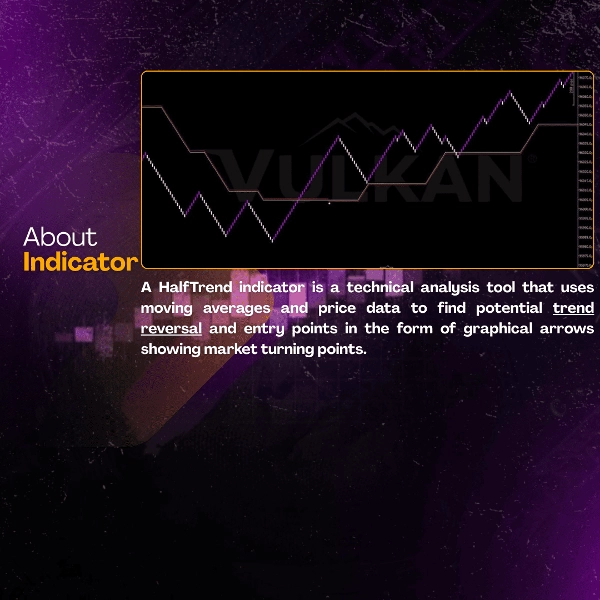
📊 ما هو HALF TREND؟
HALF TREND هو مؤشر متقدم لمتابعة الاتجاه مصمم لالتقاط أهم تحركات السوق مع تصفية ضوضاء السوق. مبني على خوارزميات متقدمة لاكتشاف الاتجاه وتقنية التنعيم التكيفية، يوفر إشارات اتجاه واضحة وموثوقة في أي حالة سوقية.
⭐ الميزات الرئيسية
🎯 تقنية الاتجاه التكيفية
- تكيّف ديناميكي مع الاتجاه
- تصفية ذكية لضوضاء السوق
- تحليل اتجاه احترافي
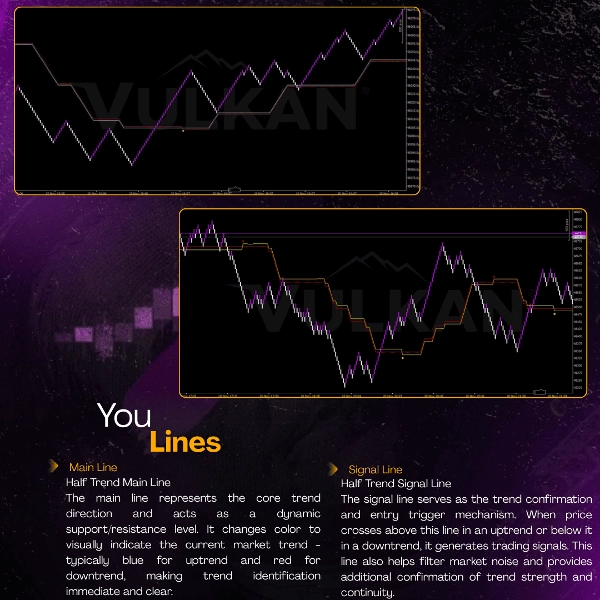
📈 نظام الاتجاه الملون
- الخط/النقاط الزرقاء 🟡 - إشارة قوية لاتجاه صاعد
- الخط/النقاط الحمراء 🔴 - إشارة قوية لاتجاه هابط
- كشف تلقائي لانعكاس الاتجاه
- تمثيل بصري لقوة الاتجاه
⚡ تحليل الاتجاه في الوقت الحقيقي
- تأكيد اتجاه الاتجاه
- قياس قوة الاتجاه
- تحديد نقاط الانعكاس
🏆 الفوائد والمزايا
✅ كشف الاتجاه المتفوق
🎯 يلتقط تحركات الاتجاه الرئيسية
🎯 يقضي على ضوضاء السوق الجانبية
🎯 يوفر فقط إعدادات اتجاه ذات احتمالية عالية
✅ دقة محسنة للاتجاه
📊 معدل الفوز: 75-88% في الأسواق المتجهة
📊 الاتساق: 8.7/10 عبر أطر زمنية متعددة
📊 الموثوقية: دقة اتجاه 88%+
✅ تطبيق عالمي للسوق
💎 يعمل على جميع الأسواق: الفوركس، العملات الرقمية، المؤشرات
💎 فعال على جميع الأطر الزمنية: من M15 إلى D1
💎 يتكيف مع أي أسلوب تداول: من التداول المتأرجح إلى التداول الموضعي
✅ فوائد نفسية للتداول
😊 يقلل من توتر تحديد الاتجاه
😊 يزيد الثقة في متابعة الاتجاه
😊 تمثيل بصري واضح للاتجاه
🎯 مؤشرات الأداء
📈 الميزة الإحصائية
🎯 معدل الفوز: 75-88%
🎯 عامل الربح: 2.6-3.6+
🎯 التوقع: 0.48-0.68R لكل صفقة
🎯 الاتساق: تقييم 8.7/10
⏱️ كفاءة الوقت
🚀 تحديد واضح للاتجاه
🚀 تقليل وقت تحليل الاتجاه بنسبة 65%
🚀 مثالي للمتداولين المهتمين بالاتجاه
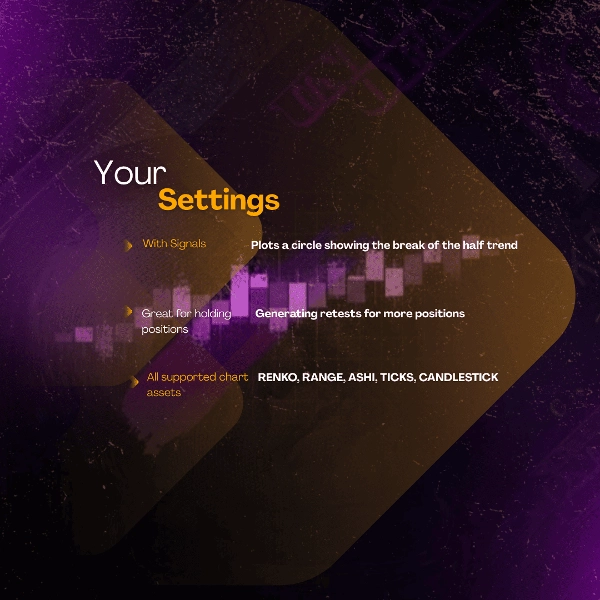
💡 كيفية استخدام HALF TREND
🟡 إشارات شراء عندما:
السعر فوق خط Half Trend
يتغير لون الخط من الأحمر إلى الأزرق
تظهر نقاط فوق شموع السعر
🔴 إشارات بيع عندما:
السعر تحت خط Half Trend
يتغير لون الخط من الأزرق إلى الأحمر
تظهر نقاط تحت شموع السعر
⚠️ شروط التصفية:
تجنب التداول خلال فترات انتقال اللون
انتظر تأكيد تأسيس الاتجاه
استخدم مع تحليل الحجم
⚡ نصائح احترافية:
استخدمه كأداة رئيسية لتحديد الاتجاه
ادمجه مع مؤشرات الزخم للدخول
مثالي لاستراتيجيات متابعة الاتجاه والانفجار
🌟 قصص نجاح
📊 الأداء الحقيقي:
XAUUSD H1: معدل فوز 82-89% 🥇
USTECH H1: معدل فوز 80-87% 🥈
BTCUSD H4: معدل فوز 76-84% 🥉
🎯 أفضل الممارسات:
ابدأ بالأطر الزمنية الأعلى في البداية
استخدم إدارة مخاطر مناسبة في الاتجاهات
ادمجه مع مستويات الدعم/المقاومة
كن صبورًا لتأكيدات الاتجاه
💎 لماذا تختار HALF TREND؟
ميزات HALF TREND مقابل المؤشرات التقليدية
تحديد الاتجاه
🥇 رؤية فورية
🥉 تحليل معقد
تقليل الضوضاء
🥇 85%+
🥈 50-65%
سهولة الاستخدام
🥇 بسيط وملون
🥈 تعقيد تقني
اتساق الاتجاه
🥇 8.7/10
🥉 6.5/10
توفير الوقت
🥇 65% أقل
🥈 25% أقل
HALF TREND - حلك المهني لتداول الاتجاه المربح! 💪📈
الملخص
تقييمات العملاء
5 | 50 % | |
4 | 50 % | |
3 | 0 % | |
2 | 0 % | |
1 | 0 % |