

الوصف
توزيع المزاج العميق (DMD) 📊🧠
نظرة عامة
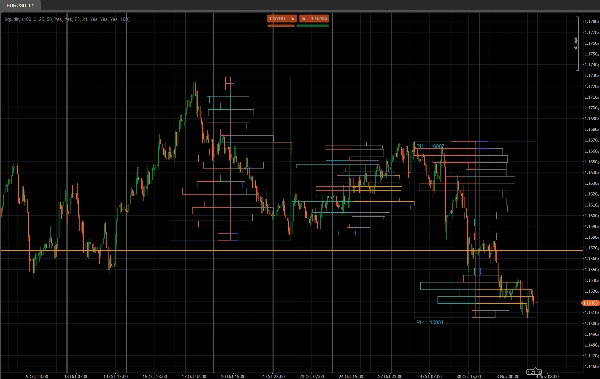
توزيع المزاج العميق (DMD) هو أداة ملف حجم مقسم وأداة معنوية تحلل حركة السعر في كتل أشرطة ثابتة وتعرض:
- أين تتركز أنشطة التداول ⚖️
- أين السيولة ضعيفة أو تفاعلية (مناطق محتملة للعرض والطلب / السيولة) 💧
- أي جانب هو المهيمن في كل منطقة سعر (المشترين مقابل البائعين) 🐂🐻
بدلاً من ملف منزلق واحد، يقوم DMD بتقسيم المخطط إلى كتل متكررة من X أشرطة ويبني خريطة سيولة ومعنويات منفصلة لكل كتلة.
هذا يجعل من السهل مقارنة بصريًا كيف توزيع الحجم ومزاج السوق يتغير من جزء إلى آخر.
كيف يعمل 🧩
لكل كتلة من الأشرطة في الملف الشموع:
- يجد المؤشر أعلى وأدنى سعر لتلك الكتلة.
- يتم تقسيم نطاق السعر إلى
عدد الصفوفصناديق سعرية رأسية. - لكل شمعة في الكتلة:
-
- يتم توزيع حجم التيك عبر كل صندوق سعري تم لمسه بواسطة نطاق الشمعة.
- يتم تجميع حجمين لكل صف:
-
- إجمالي الحجم عند ذلك الصف السعري
- حجم صعودي (فقط الأشرطة التي يكون فيها الإغلاق > الافتتاح)
- من هذه، يبني DMD:
-
- ملف السيولة (الجانب الأيمن)
-
- طول الصف ∝ الحجم النسبي مقابل الحد الأقصى لحجم الصف في الكتلة
- اللون يظهر العقد المتداولة العالية / المتوسطة / المنخفضة
- ملف المعنويات (الجانب الأيسر)
-
- المعنويات لكل صف =
2 × حجم صعودي − إجمالي الحجم - إيجابي = سيطرة المشترين (مزاج صعودي)
- سلبي = سيطرة البائعين (مزاج هبوطي)
- المعنويات لكل صف =
- يتم تكرار العملية للآخر N كتل، بحيث يمكنك مقارنة عدة أجزاء جنبًا إلى جنب.
الجانب الأيمن – ملف السيولة (الحجم) 📊
تُظهر أشرطة الجانب الأيمن كمية نشاط التداول (الحجم) التي حدثت عند كل مستوى سعري داخل تلك الكتلة، بغض النظر عمن كان يشتري أو يبيع.
- عقد الحجم العالي (HVN) – مثلاً الأشرطة البرتقالية
-
- صف يكون حجمه ≥
نسبة عتبة التداول العاليمن الحد الأقصى لحجم الصف في الكتلة - تمثل مناطق القيمة، تداول كثيف، مناطق التوحيد.
- صف يكون حجمه ≥
- عقد الحجم المنخفض (LVN) – مثلاً الأشرطة الزرقاء
-
- صف يكون حجمه ≤
نسبة عتبة التداول المنخفضمن الحد الأقصى لحجم الصف - تمثل مناطق السيولة الضعيفة، مناطق الرفض المحتملة أو مناطق التحرك السريع.
- صف يكون حجمه ≤
- عقد الحجم المتوسط – مثلاً الأشرطة الرمادية
-
- كل شيء بين العتبات العالية والمنخفضة
- مستويات التداول "العادية"، ليست متطرفة.
🧠 طول الشريط (الجانب الأيمن)
→ يتناسب مع إجمالي حجم التداول عند ذلك الصف السعري مقارنة بأقصى حجم في الكتلة.
كلما زاد الحجم → كلما كان الشريط أطول.
المعلمات الرئيسية:
نسبة عتبة التداول العالينسبة عتبة التداول المنخفض
الجانب الأيسر – ملف المعنويات (مزاج السوق) 🧠📉📈
تُظهر أشرطة الجانب الأيسر المعنويات / الهيمنة عند كل مستوى سعري: سواء كان المشترون أو البائعون أقوى في ذلك الصف.
لكل صف:
المعنويات=2×حجم صعودي−إجمالي الحجم\text{Sentiment} = 2 \times \text{BullishVolume} - \text{TotalVolume}المعنويات=2×حجم صعودي−إجمالي الحجم
- شريط صعودي (المشترين في السيطرة) – مثلاً الأشرطة الفيروزية/الخضراء
-
- المعنويات > 0
- جاء المزيد من الحجم من الشموع الصعودية (الإغلاق > الافتتاح) عند ذلك السعر.
- يشير إلى هيمنة جانب الشراء في ذلك الصف السعري.
- شريط هبوطي (البائعين في السيطرة) – مثلاً الأشرطة الحمراء
-
- المعنويات < 0
- جاء المزيد من الحجم من الشموع الهبوطية (الإغلاق < الافتتاح).
- يشير إلى هيمنة جانب البيع.
🧠 طول الشريط (الجانب الأيسر)
→ يتناسب مع القيمة المطلقة للمعنويات (|المعنويات|) نسبة إلى أقوى صف في الكتلة.
هيمنة أقوى (اختلال كبير بين المشترين والبائعين) → شريط أطول.
المعلمة الرئيسية:
عرض ملف المعنويات(تشغيل/إيقاف)
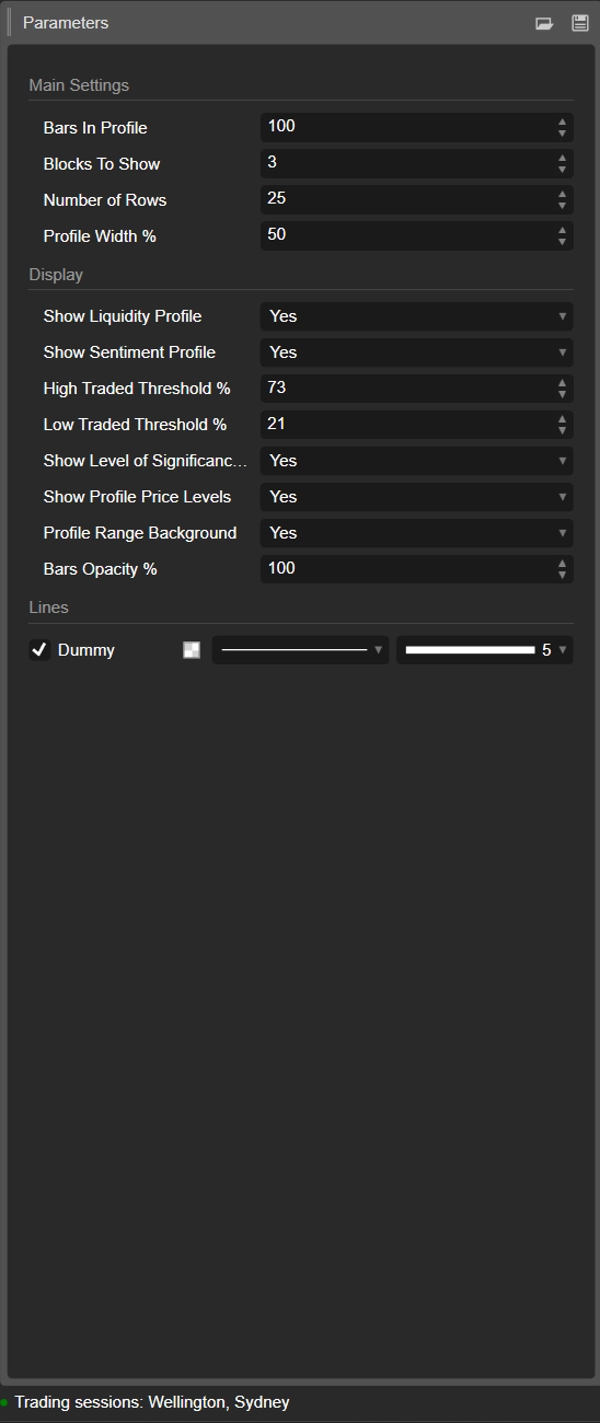
تفاصيل المعلمات ⚙️
1. الأشرطة في الملف
المجموعة: الإعدادات الرئيسية
عدد الشموع المحتواة في كل كتلة.
- مثال:
الأشرطة في الملف = 100 -
- الكتلة 0 → آخر 100 شريط
- الكتلة 1 → 100 شريط السابقة
- الكتلة 2 → 100 السابقة، وهكذا.
استخدمها لمطابقة الكتل مع:
- تقريبًا الجلسات،
- نطاق التأرجح / التداول اليومي النموذجي الخاص بك،
- أو أي نافذة مخصصة تريد تحليلها.
القيمة الأصغر = أكثر تفاعلية، أكثر تفصيلاً.
القيمة الأكبر = هيكل أكثر سلاسة و"ماكرو".
2. الكتل للعرض
المجموعة: الإعدادات الرئيسية
كم عدد الكتل المتتالية التي سيتم رسمها على المخطط.
1→ فقط الكتلة الأحدث2–3→ عملي جدًا للمقارنة بدون ازدحام- القيم الأعلى → المزيد من التاريخ، ولكن المزيد من الكائنات على المخطط
يتم تنظيف الكتل الأقدم تلقائيًا للحفاظ على الاستقرار.
3. عدد الصفوف
المجموعة: الإعدادات الرئيسية
الدقة الرأسية لملف كل كتلة.
يتم تقسيم نطاق سعر الكتلة إلى هذا العدد من الصفوف (مستويات السعر).
- القيمة الأعلى → مزيد من التفاصيل، صفوف أرق، المزيد من المستطيلات
- القيمة الأقل → هيكل أكثر سلاسة، أسهل للقراءة
النطاقات النموذجية:
15–25للاستخدام اليومي العادي30–40+فقط إذا كنت تريد دقة عالية جدًا ومنصتك قوية بما فيه الكفاية
4. عرض الملف %
المجموعة: الإعدادات الرئيسية
يتحكم في مدى امتداد الملف أفقياً من مركز الكتلة، كنسبة مئوية من عرض الكتلة.
- يؤثر على كل من السيولة (الجانب الأيمن) والمعنويات (الجانب الأيسر).
- نسبة مئوية أعلى → تمتد الملفات أبعد إلى الأشرطة المحيطة
- نسبة مئوية أقل → ملف مضغوط قريب من مركز الكتلة
قيم بداية جيدة: 35–50%.
5. عرض ملف السيولة
المجموعة: العرض
يقوم بتشغيل أو إيقاف توزيع الحجم (ملف السيولة) (الجانب الأيمن من كل كتلة).
- تشغيل ✅
-
- يعكس طول كل صف الحجم المتداول النسبي عند ذلك المستوى السعري.
- اللون يرمز إلى العقد المتداولة العالية / المتوسطة / المنخفضة.
- إيقاف ❌
-
- يتم عرض المعنويات فقط (إذا تم تمكينها)، ولا توجد أشرطة حجم على اليمين.
6. عرض ملف المعنويات
المجموعة: العرض
يقوم بتشغيل أو إيقاف ملف المعنويات (الجانب الأيسر من كل كتلة).
- تشغيل ✅
-
- يتم تلوين الصفوف:
-
- صعودي (المشترين مهيمنون) – مثلاً فيروزي/أخضر
- هبوطي (البائعين مهيمنون) – مثلاً أحمر
- يعكس طول الصف قوة الهيمنة.
- إيقاف ❌
-
- يتم عرض توزيع السيولة/الحجم النقي فقط.
استخدم هذا إذا كنت تريد أن ترى ليس فقط أين تم تداول الحجم، ولكن من كان أكثر نشاطًا عند تلك المستويات.
7. نسبة عتبة التداول العالي
المجموعة: العرض
تعرف الحد الفاصل لـ عقد الحجم العالي (HVNs) داخل كل كتلة.
- يُعبر عنها كنسبة مئوية من الحد الأقصى لحجم الصف في الكتلة.
- مثال: الحد الأقصى لحجم الصف = 10,000؛ العتبة = 70% → الصفوف ≥ 7,000 تُعتبر HVNs.
غالبًا ما تشير HVNs إلى:
- مناطق القيمة،
- مناطق التوحيد،
- مناطق التموضع القوي / القيمة العادلة.
8. نسبة عتبة التداول المنخفض
المجموعة: العرض
تعرف الحد الفاصل لـ عقد الحجم المنخفض (LVNs) نسبة إلى الحد الأقصى لحجم الكتلة.
- الصفوف التي يكون حجمها أقل من هذه النسبة تُعامل كمناطق نشاط منخفض.
- يمكن أن تعمل هذه كمناطق:
-
- جيوب سيولة ضعيفة،
- مستويات رفض محتملة،
- أو مناطق يميل السعر إلى التحرك بسرعة من خلالها.
الاستخدام النموذجي: 15–30%.
9. عرض مستوى الأهمية (POC)
المجموعة: العرض
يعرض أو يخفي نقطة التحكم (POC) للكتلة الأحدث.
- POC = صف السعر الذي يحتوي على أعلى حجم تداول في تلك الكتلة.
- يُعرض كخط أفقي عند ذلك السعر. 🎯
مفيد كـ:
- مرجع للارتداد المتوسط،
- مرساة "السعر العادل" اليومي،
- أو مستوى رئيسي لإدارة التداول.
10. عرض مستويات سعر الملف
المجموعة: العرض
يعرض تسميات نصية لـ:
- أعلى ملف (PH) – أعلى سعر تم الوصول إليه في الكتلة
- أدنى ملف (PL) – أدنى سعر تم الوصول إليه في الكتلة
يتم عرض التسميات للكتلة الأحدث وتشمل القيم السعرية الدقيقة.
مفيد لـ:
- قراءة النطاق الحالي بسرعة،
- تعيين وقف/أهداف حول PH/PL،
- السياق للاختراقات أو التدويرات.
11. خلفية نطاق الملف
المجموعة: العرض
يرسم مستطيل خلفية نصف شفاف يغطي:
- نطاق الوقت (من بداية إلى نهاية الشريط)
- نطاق السعر (من الأدنى إلى الأعلى)
هذا يفصل الكتل بصريًا ويجعل كل نطاق بارزًا.
قم بإيقاف تشغيله إذا كنت تفضل مظهرًا نظيفًا وبسيطًا.
12. شفافية الأشرطة %
المجموعة: العرض
يتحكم في مدى صلابة أو خفة المستطيلات (كلا من أشرطة السيولة والمعنويات).
- 20–40% → خفيف جدًا، بأسلوب الخلفية
- 50–70% → رؤية متوازنة، الشموع لا تزال سهلة الرؤية
- 80–100% → كتل قوية، شبه معتمة بالكامل
داخليًا يتم تحويل هذه القيمة إلى قناة ألفا (0–255) لألوان الأشرطة.
قالب بداية مقترح ⭐
لمؤشرات / العقود الآجلة اليومية (M5–M15):
- الأشرطة في الملف: 80–120
- الكتل للعرض: 2–3
- عدد الصفوف: ~20
- عرض الملف %: 35–45
- عرض ملف السيولة: true
- عرض ملف المعنويات: true
- شفافية الأشرطة %: 50–65
الملخص
Key features include:
- Liquidity Profile (right side): Displays trading volume concentration at each price level within a block, highlighting high-volume nodes (HVNs), low-volume nodes (LVNs), and average-volume nodes. Bar length corresponds to relative traded volume, and colors indicate volume intensity.
- Sentiment Profile (left side): Shows buyer vs. seller dominance per price level, calculated as twice the bullish volume minus total volume. Positive values indicate buy-side control; negative values indicate sell-side control. Bar length reflects the strength of dominance, with color coding for bullish (green/teal) and bearish (red) sentiment.
- Configurable parameters: number of bars per profile block, number of blocks displayed, vertical resolution (rows), profile width, opacity, and thresholds for defining HVNs and LVNs.
- Additional display options: Point of Control (POC) line for highest volume price in the latest block, profile high/low price labels, and background shading for block ranges.
DMD supports analysis across various markets including indices, commodities, forex, and cryptocurrencies, facilitating identification of trading activity concentration, liquidity zones, and market sentiment shifts within customizable timeframes.
تقييمات العملاء
5 | 0 % | |
4 | 100 % | |
3 | 0 % | |
2 | 0 % | |
1 | 0 % |


![شعار "[Hamster-Coder] Moving Average MTF"](https://cdn.ctrader.com/image/webp/b11b98b1-194d-4b8e-b00e-d611826ad159_31226)


