
Opis
Poprzedni dzień - maksimum / minimum – Virgin Levels Ultimate
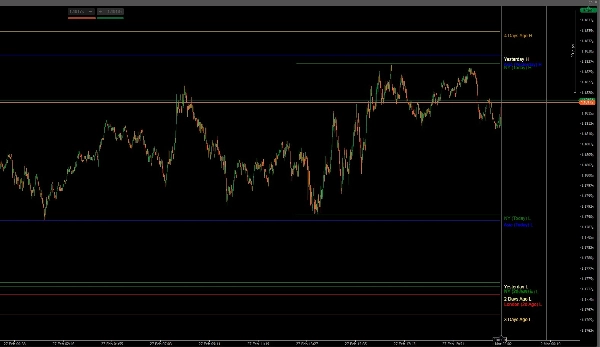
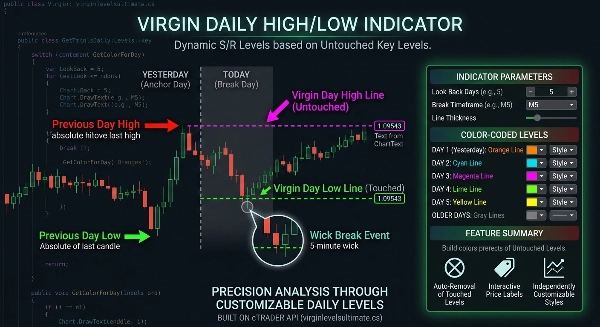
Virgin Levels Ultimate to precyzyjny wskaźnik śledzenia poziomów, który automatycznie rysuje nietknięte maksima i minima z poprzednich dni handlowych i utrzymuje je na wykresie, dopóki cena ich nie przebije.
Stworzony dla traderów, którzy rozumieją, że nietknięte poziomy płynności działają jak magnesy na cenę, to narzędzie daje czysty, uporządkowany schemat do realizacji wybicia i odwrócenia.
Teraz rozszerzony o maksima/minima sesji Azji, Londynu i Nowego Jorku, oraz poprzednie poziomy tygodniowe i miesięczne, tworząc kompletną mapę płynności wieloczasową.
Przeznaczony dla Forex, indeksów, złota i kryptowalut — na wszystkich interwałach czasowych.
Handluj kluczową płynnością. Handluj precyzyjnie.
⚙ Główne Silnik
- Automatyczne wykrywanie poprzednich dziennych maksimów i minimów
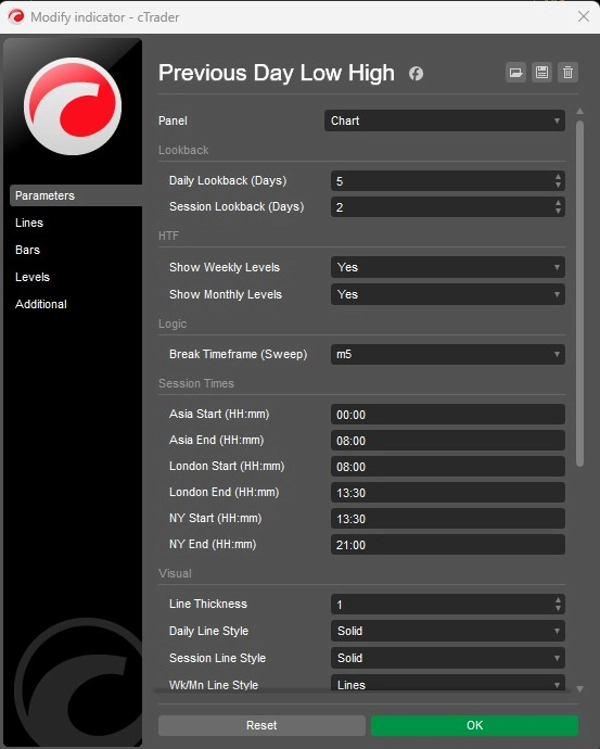
- Konfigurowalny okres retrospektywny dzienny (śledzenie wielu poprzednich dni)
- Wykrywanie maksimów/minimów sesji Azji, Londynu i Nowego Jorku
- Kontrola okresu retrospektywnego sesji (śledzenie wielu poprzednich sesji)
- Poprzednie maksimum / minimum tygodniowe (opcjonalnie)
- Poprzednie maksimum / minimum miesięczne (opcjonalnie)
- Poziomy aktywują się dopiero od następnego ważnego okresu handlowego
- Automatyczne usuwanie po dotknięciu poziomu (brak bałaganu)
- Wykrywanie wybicia na podstawie wybranego niższego interwału czasowego
- Weryfikacja poziomów w czasie rzeczywistym
📊 Logika Virgin Level
- Rysuje tylko nietknięte (virgin) maksima i minima
- Wyraźne rozdzielenie poziomów dziennych, sesyjnych, tygodniowych i miesięcznych
- Śledzenie wielodniowe (Dzień 1 do Dzień 5+)
- Śledzenie sesji (Dzisiaj, Wczoraj, niestandardowy okres retrospektywny)
- Starsze dni wizualnie wyróżnione
- Dynamiczne mapowanie wsparcia i oporu
- Schemat wybicia oparty na płynności
- Struktura konfluencji wieloczasowej
🕒 Inteligentne wykrywanie wybicia
- Wybieralny interwał czasowy wybicia (np. M5, M15 itd.)
- Precyzja wewnątrzdzienna dla unieważnienia poziomu
- Skanowanie maksimów/minimów od czasu ważnej aktywacji
- Działa na poziomach dziennych, sesyjnych, tygodniowych i miesięcznych
- Natychmiastowe zaprzestanie rysowania po potwierdzonym dotknięciu
- Czysta logika wykresu — brak historycznego nadrysowania
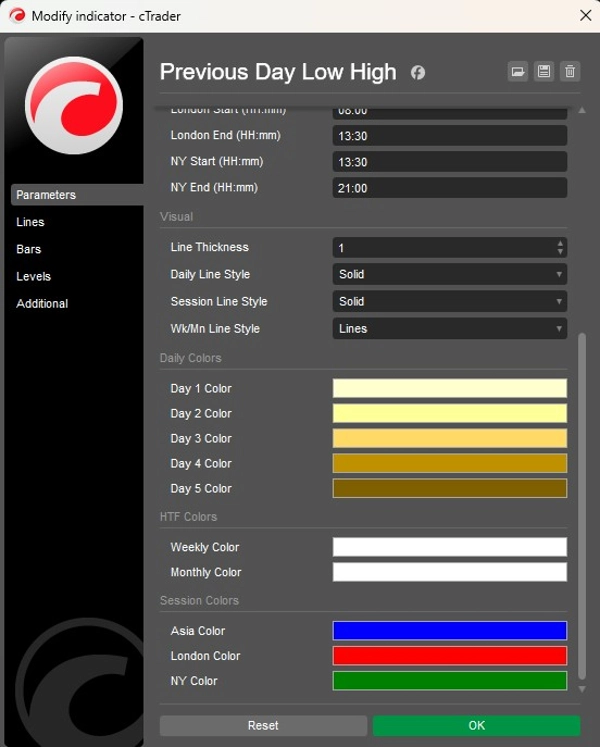
🎨 Pełna personalizacja
- Niezależna kontrola kolorów dla każdego dziennego okresu retrospektywnego
- Dedykowane kolory dla sesji Azji, Londynu i Nowego Jorku
- Oddzielne kolory dla poziomów tygodniowych i miesięcznych
- Regulowane style linii (Dzienny / Sesyjny / HTF)
- Ustawienia grubości linii
- Automatyczne etykiety cen z inteligentnym układaniem (bez nakładania się)
- Minimalistyczny, profesjonalny wygląd wykresu
🎯 Idealne dla
- Traderów wykonujących zlecenia na płynność
- Traderów wybicia i fałszywych wybicia
- Traderów stylu SMC / ICT
- Traderów sesyjnych (Azja, Londyn, NY)
- Traderów intraday i swing
- Systemy oparte na zasadach firm prop
- Traderów multi-asset (Forex, indeksy, metale, kryptowaluty)
Podsumowanie
Key features include automatic detection and plotting of prior highs and lows, customizable lookback periods for days and sessions, real-time validation, and automatic removal of levels once touched to reduce chart clutter. It visually distinguishes older levels and separates daily, session, weekly, and monthly levels with independent color and style customization. The tool supports dynamic support and resistance mapping and provides a liquidity-based breakout framework suitable for Forex, indices, gold, cryptocurrencies, and other markets.
This indicator is suitable for liquidity sweep traders, breakout and fakeout strategies, smart money concept (SMC) and institutional trading (ICT) styles, session-based trading, intraday and swing trading, prop firm rule-based systems, and multi-asset trading. It offers a professional, minimal chart appearance with auto price labels and smart stacking.
Opinie klientów
5 | 100 % | |
4 | 0 % | |
3 | 0 % | |
2 | 0 % | |
1 | 0 % |


