
Descrição
Indicador de Swing High / Low e Quebra de Estrutura
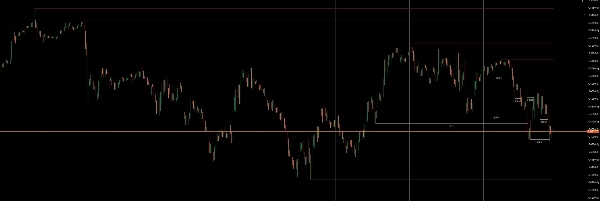
Estrutura de Mercado Limpa detecta automaticamente Swing Highs e Swing Lows e traça níveis dinâmicos de Suporte e Resistência com base na estrutura de pivô confirmada.
Os níveis se estendem para frente no tempo até que o preço os quebre. Quando ocorre uma Quebra de Estrutura (BOS), o nível é convertido em uma linha histórica com um rótulo de quebra, permitindo que os traders identifiquem rapidamente mudanças estruturais e varreduras de liquidez.
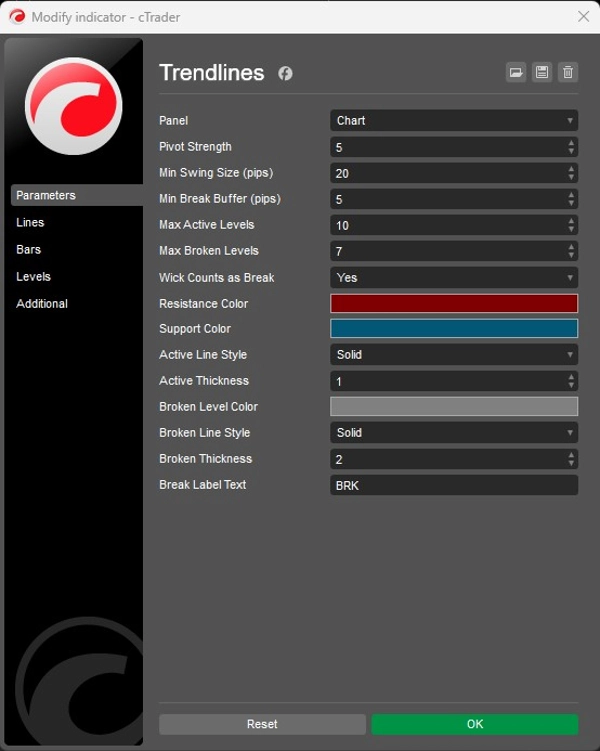
O indicador inclui filtros como tamanho mínimo do swing e buffers de quebra para ignorar pivôs insignificantes e focar apenas na estrutura de mercado significativa.
Níveis ativos e quebrados usam estilos visuais separados, enquanto limites incorporados mantêm o gráfico limpo controlando quantos níveis permanecem visíveis.
Como os pivôs são confirmados apenas após o fechamento do número necessário de velas, a lógica da estrutura é estável e não repintável.
Principais Características
• Detecção automática de Swing High / Swing Low
• Níveis dinâmicos de Suporte & Resistência
• Marcação automática de Quebra de Estrutura (BOS)
• Filtro de swing mínimo para remover ruído
• Detecção opcional de quebra por pavio ou fechamento
• Estilização separada para níveis ativos vs quebrados
• Limites para níveis ativos e históricos para manter os gráficos limpos
• Lógica de pivô não repintável
Ideal Para
• Trading de Price Action
• Estratégias de Suporte & Resistência
• Trading baseado em liquidez
• Sistemas de Quebra de Estrutura
• Scalping, intraday e swing trading
Resumo
Avaliações de clientes
5 | 67 % | |
4 | 33 % | |
3 | 0 % | |
2 | 0 % | |
1 | 0 % |


