
Opis
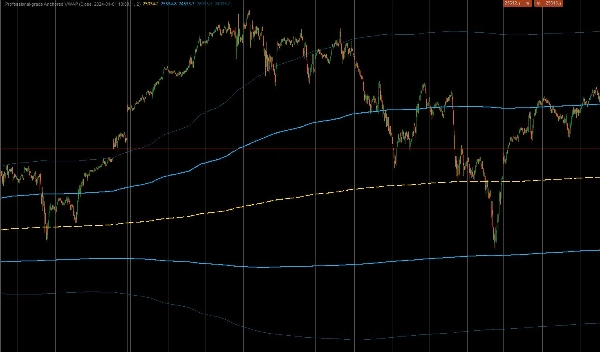
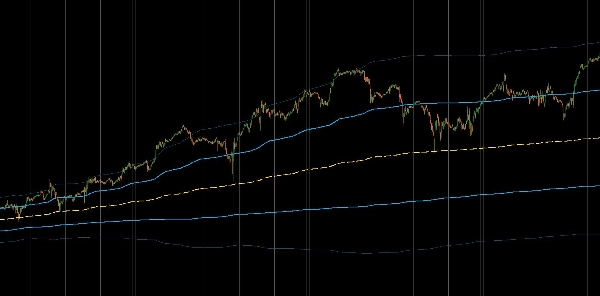
To jest profesjonalny, niestandardowy wskaźnik dla cTrader zaprojektowany do obliczania Zakotwiczonej Średniej Ważonej Wolumenem Ceny (AVWAP). W przeciwieństwie do standardowych wskaźników VWAP, które resetują się codziennie, to narzędzie pozwala traderom "zakotwiczyć" obliczenia do konkretnego wydarzenia o dużym wpływie — takiego jak publikacja CPI, krach na rynku czy początek trendu — zapewniając prawdziwy instytucjonalny obraz średniej ceny od tego momentu. Zawiera również Wstęgi Odchylenia Standardowego ważone wolumenem, aby identyfikować nadmiernie rozciągnięte ruchy cenowe.
1. Podstawowe obliczenia i logika kotwiczenia
- Precyzyjne kotwiczenie: Wskaźnik wykorzystuje zdefiniowaną przez użytkownika
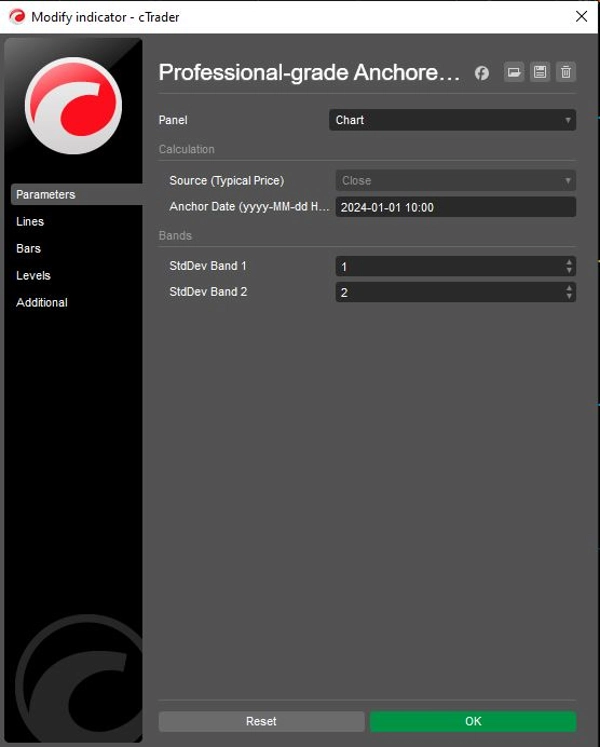
Datę Kotwicy(np. "2024-01-01 10:00"), aby ściśle ignorować wszystkie dane sprzed tej konkretnej minuty. Zapewnia to, że średnia cena odzwierciedla tylko uczestników zaangażowanych w aktualny, specyficzny ruch lub ramy czasowe. - Formuła instytucjonalna: Oblicza prawdziwy VWAP, używając skumulowanej sumy (Cena × Wolumen) podzielonej przez skumulowaną sumę Wolumenu.
- Typowe źródło ceny: Domyślnie używa "Typowej ceny"
(High + Low + Close) / 3do obliczeń, co jest standardową metodą stosowaną przez algorytmy instytucjonalne do określania wartości godziwej, choć można to dostosować do cen otwarcia lub zamknięcia.
2. Zaawansowane wstęgi zmienności
Aby pomóc traderom ocenić ekstremalne warunki rynkowe, wskaźnik oblicza dwa zestawy dynamicznych wstęg opartych na Wariancji ważonej wolumenem:
- Wstęga 1 (Strefa wartości): Domyślnie ustawiona na 1,0 odchylenia standardowego. Ta wewnętrzna strefa zazwyczaj zawiera "szum" wartości godziwej rynku. Przebicie tej strefy często sygnalizuje momentum.
- Wstęga 2 (Strefa ekstremalna): Domyślnie ustawiona na 2,0 odchylenia standardowego. Ceny osiągające tę zewnętrzną wstęgę są statystycznie nadmiernie rozciągnięte, często sygnalizując potencjalne okazje do powrotu do średniej (odwrócenie ruchu) lub silne wyczerpanie trendu.
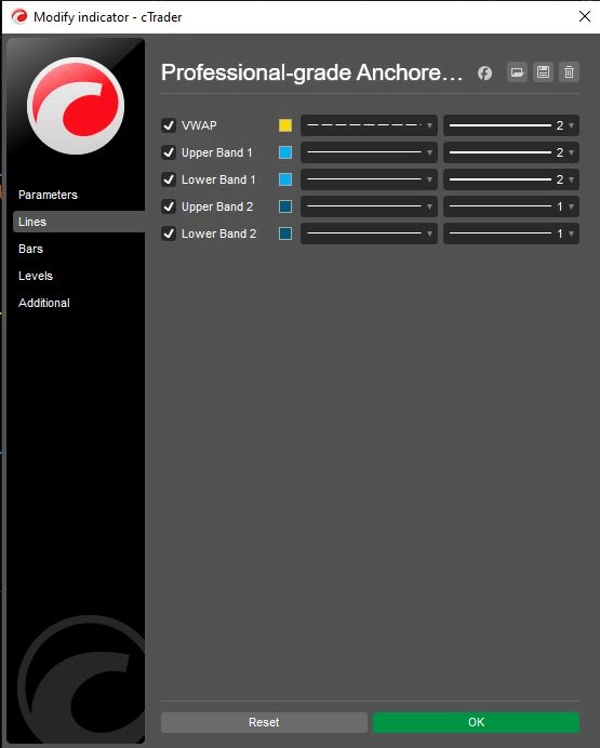
- Niezależna kontrola: Obie wstęgi zawierają indywidualne przełączniki
Show(ShowBand1,ShowBand2) oraz konfigurowalne mnożniki odchylenia (Band1Dev,Band2Dev), co pozwala na czyste wykresy dostosowane do konkretnych strategii zmienności.
3. Logika wizualna i operacyjna
- Strategiczne kodowanie kolorów:
-
- Żółty (VWAP): Działa jako centralny "magnes" lub linia bazowa trendu.
- Limonkowy (Wstęga 1): Reprezentuje natychmiastowy obszar wsparcia/oporu "Strefę wartości".
- Czerwony (Wstęga 2): Podkreśla ekstremalne odchylenia, gdzie rośnie prawdopodobieństwo odwrócenia.
- Zachowanie stanu: Kod wykorzystuje
IndicatorDataSeriesdla wewnętrznych zmiennych stanu (_cumVol,_cumPV), zapewniając, że wartości pozostają dokładne podczas historycznych przeliczeń i aktualizacji w czasie rzeczywistym bez błędów przerysowywania.
Podsumowanie przepływu logiki
- Inicjalizacja: Parsuj specyficzny dla użytkownika ciąg znaków Daty Kotwicy do obiektu DateTime systemu.
- Filtrowanie czasu: Dla każdej świecy sprawdź, czy aktualny czas jest przed Kotwicą. Jeśli tak, zwróć
NaN(nie rysuj nic) i zresetuj skumulowane liczniki do zera. - Akumulacja danych: Po osiągnięciu czasu Kotwicy zacznij dodawać wolumen bieżącej świecy oraz (Cena × Wolumen) do sumy bieżącej.
- Oblicz VWAP: Podziel sumę PV przez sumę wolumenu, aby uzyskać linię VWAP.
- Oblicz wariancję: Oblicz wariancję ważoną wolumenem i wyprowadź odchylenie standardowe.
- Narysuj wstęgi: Dodaj/odejmij obliczone odchylenie od VWAP, aby narysować wstęgi limonkową i czerwoną.
Podsumowanie
Key features include:
- Precision anchoring to a user-specified date and time, ignoring data before that moment.
- Institutional VWAP calculation using cumulative (Price × Volume) divided by cumulative Volume.
- Default use of Typical Price ((High + Low + Close) / 3) for fair value, adjustable to Open or Close prices.
- Two dynamic volatility bands based on volume-weighted variance: Band 1 (1 standard deviation) representing the value zone, and Band 2 (2 standard deviations) indicating extreme price deviations.
- Independent toggles and customizable deviation multipliers for each band.
- Strategic color coding: yellow for VWAP, lime green for Band 1, and red for Band 2.
- Internal state preservation ensures accurate values during historical and real-time updates without repainting.
The indicator supports markets including Forex, indices, commodities, stocks, and cryptocurrencies, and is suitable for various symbols such as BTCUSD, EURUSD, GBPUSD, XAUUSD, and NAS100.
Opinie klientów
5 | 50 % | |
4 | 50 % | |
3 | 0 % | |
2 | 0 % | |
1 | 0 % |


