Opis
⚠️ Przenieśliśmy się do 👉 PrimeQuant
🚫🚫🚫 Nie kupuj tego wskaźnika!
Ten wskaźnik OHLC PRO autorstwa LudwigICT to wielofunkcyjne narzędzie nakładkowe na wykres, zaprojektowane, aby zapewnić profesjonalną, bogatą w informacje wizualizację na Twoim wykresie cTrader.
Oto przegląd jego funkcji:
🔹 Główna funkcja: Nakładka OHLC
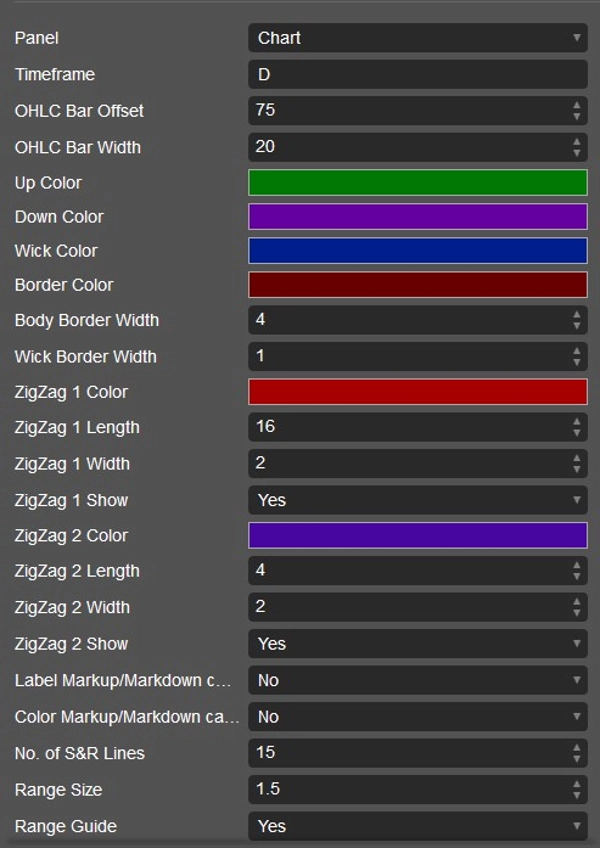
- Rysuje niestandardowe słupki OHLC (Open, High, Low, Close) na Twoim wykresie.
- Możesz ustawić:
-
- Który interwał czasowy OHLC użyć (Dzienny, Tygodniowy, Miesięczny lub wewnątrzdzienny jak H1, M15 itp.).
- Przesunięcie słupka (odległość od aktualnych świec).
- Szerokość słupka, knot, obramowania i niestandardowe kolory.
- W praktyce otrzymujesz „świece referencyjne” z wyższych interwałów umieszczone na aktualnym wykresie.
🔹 Konfiguracja Triple-M (sygnały bycze/niedźwiedzie)
- Wykrywa wzór kolejnych wyższych dołków (byczy) lub niższych szczytów (niedźwiedzi).
- Po wykryciu:
-
- Może umieścić ikony trójkątów (w górę lub w dół) na świecach.
- Może także zmienić kolor słupków, aby pokazać zmianę momentum.
- Działa to jak sygnał zmiany struktury momentum.
🔹 Podwójne narzędzia ZigZag
- Dwie niezależne nakładki ZigZag:
-
- ZigZag #1 (dłuższa długość, np. struktura swingowa).
- ZigZag #2 (krótsza długość, np. mikro swingi).
- Podkreśla ruchy rynkowe dla analizy struktury, trendu i wybicia.
🔹 Wsparcie i opór Ganna
- Używa tabeli liczb Ganna + logiki ATR do obliczania poziomów wsparcia/oporu.
- Rysuje wiele linii wsparcia/oporu powyżej i poniżej ceny.
- Linie mogą mieć różne style (ciągłe, kropkowane, rozszerzone w lewo itp.).
- Etykietuje poziomy wartościami cenowymi.
- Daje także przewodniki zakresu:
-
- „Poprzedni zakres” vs. „Następny zakres” względem ATR.
- Pomaga prognozować strefy rozszerzenia lub kurczenia się.
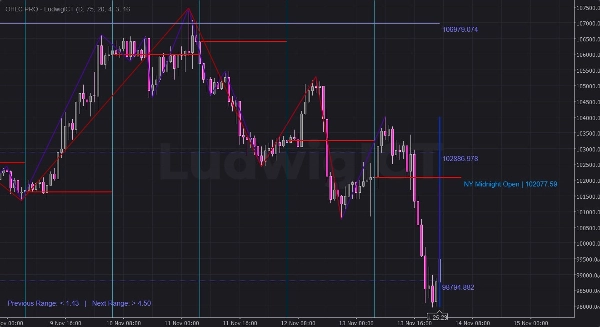
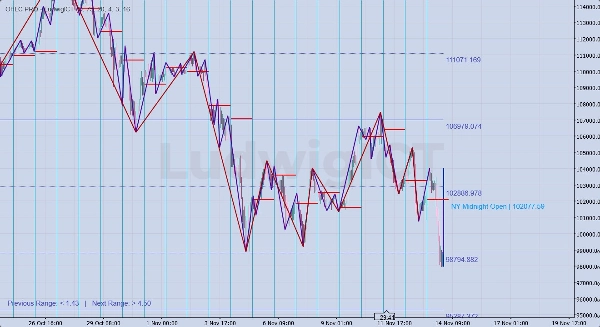
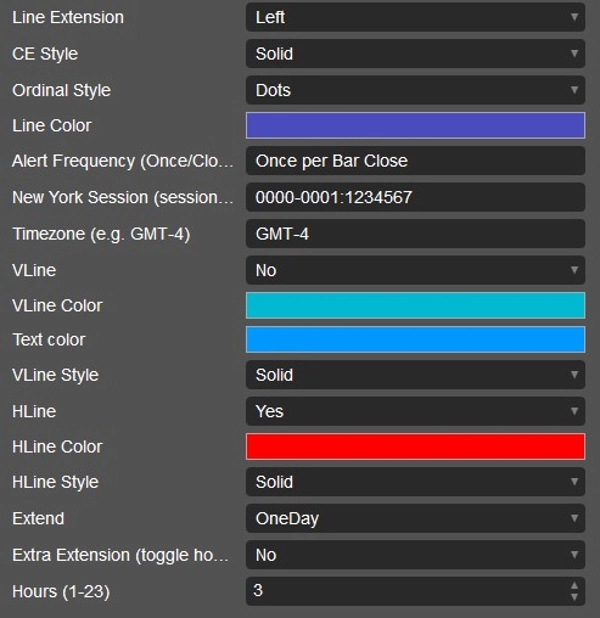
🔹 Poziomy północy Nowego Jorku
- Automatycznie wykrywa cenę otwarcia sesji Nowego Jorku o północy.
- Rysuje:
-
- Linię poziomą na cenie otwarcia o północy NY.
- Linię pionową na początku sesji.
- Etykiety pokazujące „NY Midnight Open | cena”.
- Możesz przedłużyć te linie na 1 lub 2 dni albo dodać dodatkowe godziny.
- Przydatne dla handlu w stylu ICT (nastawienie sesji Nowego Jorku, punkty równowagi itp.).
🔹 Personalizacja i alerty
- Każda funkcja ma parametry w rozwijanych listach:
-
- Kolory, style, rozszerzenia linii, liczba linii itp.
- Obsługa alertów (choć głównie wizualnie na wykresie — parametr częstotliwości alertów jest dostępny).
- Czyste usuwanie przy zamknięciu wskaźnika (aby wykres nie był zagracony).
✅ W skrócie:
Ten wskaźnik to wielozadaniowe narzędzie do analizy price action. Łączy:
- Świece OHLC z wyższych interwałów
- Sygnały wzorców momentum (Triple-M)
- Dwie struktury ZigZag
- Poziomy wsparcia/oporu Ganna + przewodniki zakresu
- Markery otwarcia sesji Nowego Jorku o północy
Jest stworzony do handlu opartego na strukturze, sesjach i poziomach, szczególnie przydatny dla traderów w stylu ICT lub price action.
Wyjaśniam jak można go praktycznie używać podczas handlu XAU/USD
🔹 Praktyczne zastosowanie w handlu (Złoto z OHLC PRO)
1. Nakładka OHLC z wyższego interwału
- Przykład: Nanieś dzienny OHLC podczas handlu na M5/M15.
- Zobaczysz świecę z wczoraj „wewnątrz” wykresu wewnątrzdziennego.
- Zastosowanie:
-
- Cena zbliża się do wczorajszego maksimum/minimum = obszar polowania na płynność.
- Otwarcie/zamknięcie dnia = filtr nastawienia (powyżej = bycze, poniżej = niedźwiedzie).
- Pomaga handlować w obrębie dziennego zakresu.
👉 Na złocie sesja NY często atakuje wczorajsze maksimum/minimum przed odwróceniem.
2. Sygnały Triple-M
- Wzór Triple-M (seria rosnących dołków lub opadających szczytów) = krótkoterminowe momentum.
- Zastosowanie:
-
- Byczy Triple-M blisko wsparcia (niski HTF lub otwarcie NY o północy) → możliwy szybki long.
- Niedźwiedzi Triple-M blisko oporów (wysoki HTF lub poziom Ganna) → możliwy szybki short.
- Może kolorować słupki dla szybkiego rozpoznania podczas szybkich ruchów na złocie.
👉 Dobrze działa dla precyzyjnych wejść snajperskich na M1–M5, gdy jest zgodne z nastawieniem HTF.
3. Podwójny ZigZag
- ZigZag #1 (dłuższa długość) = struktura swingowa.
- ZigZag #2 (krótsza długość) = mikro struktura.
- Zastosowanie:
-
- Identyfikuj przełamania struktury rynku (BOS/CHOCH).
- Handluj tylko w kierunku większego ZigZag (#1).
- Używaj mniejszego ZigZag (#2) do potwierdzenia wejścia.
👉 Przykład: Dzienny bias byczy → czekaj na zmianę ZigZag #2 na byczą blisko wsparcia HTF.
4. Wsparcie i opór Ganna
- Generuje siatkę matematycznych poziomów wsparcia/oporu.
- Zastosowanie:
-
- Jeśli cena konsoliduje, poziomy oznaczają prawdopodobne punkty wybicia rozszerzenia.
- Połącz z przewodnikiem zakresu ATR:
-
- „Poprzedni zakres” mały → oczekuj rozszerzenia zmienności.
- „Następny zakres” wysoki → silny poziom wybicia przed nami.
👉 Na złocie poziomy Ganna często pokrywają się z okrągłymi liczbami (np. 2400, 2420, 2435).
5. Otwarcie sesji Nowego Jorku o północy
- To jedno z najpotężniejszych narzędzi ICT dla złota.
- Zastosowanie:
-
- Cena względem otwarcia NY o północy = kierunkowe nastawienie.
- Jeśli cena pozostaje powyżej otwarcia o północy → bycza sesja NY.
- Jeśli poniżej → nastawienie niedźwiedzie.
- Linia pozioma działa jako referencja równowagi (50%).
- Obserwuj polowania na płynność wokół tego poziomu w killzonach Londynu/NY.
👉 Przykład:
Otwarcie NY o północy = 2405.
- Jeśli Londyn zepchnie cenę do 2398, a NY odzyska 2405 → silna konfiguracja long.
🔑 Łączenie elementów (przykładowa konfiguracja)
- Rozpocznij sesję NY:
-
- Nanieś dzienny OHLC.
- Zanotuj otwarcie NY o północy.
- Obserwuj pobliskie poziomy Ganna.
- Czekaj na chwytanie płynności (atak na dzienne maksimum/minimum lub wsparcie/opór Ganna).
- Sprawdź Triple-M / ZigZag #2 dla mikro potwierdzenia byczego/niedźwiedziego.
- Wejdź z zleceniem stop za polowaniem na płynność.
- Celuj w przeciwną stronę zakresu lub następny poziom Ganna/HTF.
✅ W skrócie:
- Dzienny OHLC + NY Midnight = filtr nastawienia.
- ZigZag + Triple-M = timing wejścia.
- Gann + przewodnik zakresu = cele zysku i sygnały rozszerzenia.
Ten wskaźnik zasadniczo daje Ci wszystkie narzędzia w stylu ICT w jednym pakiecie dla XAU/USD.
Jeśli masz pytania lub napotkasz problemy, śmiało się ze mną skontaktuj. Chętnie pomogę!
Zastrzeżenie:
Korzystając z moich algorytmów, przyjmujesz do wiadomości, że handel wiąże się z ryzykiem i że wyniki historyczne nie gwarantują przyszłych rezultatów. Niezbędne jest posiadanie solidnej strategii zarządzania ryzykiem i, co najważniejsze, dyscypliny w przestrzeganiu poziomów stop-loss. Nieprawidłowe zarządzanie ryzykiem może prowadzić do znacznych strat. Nie ponoszę odpowiedzialności za jakiekolwiek skutki finansowe wynikające z używania tych algorytmów. Handluj odpowiedzialnie i zawsze stosuj właściwe praktyki zarządzania ryzykiem.
Błogosławieństwa! 🙌
Podsumowanie
Opinie klientów
5 | 100 % | |
4 | 0 % | |
3 | 0 % | |
2 | 0 % | |
1 | 0 % |


