
Opis
⚡ DOSTĘPNA WERSJA NOWEJ GENERACJI: 🚫🚫🚫 Nie kupuj tego wskaźnika tutaj!
Klasyczne narzędzie LudwigICT zostało przeprojektowane, zrestrukturyzowane i ponownie wydane pod naszą nową marką deweloperską, PrimeQuant. Nowa wersja oferuje uproszczony interfejs użytkownika i zaktualizowane właściwości dostosowane do obecnych warunków rynkowych. Pobierz ulepszoną wersję w obniżonej cenie tutaj:
👉 Logarithmic Market Map Pro
👉 Logarithmic Market Map Pro
👉 Logarithmic Market Map Pro
⚠️ Przenieśliśmy się do 👉 PrimeQuant
(Proszę zauważyć: oferta LudwigICT pozostaje aktywna dla użytkowników dziedzicznych, ale nie będzie już otrzymywać aktualizacji ani aktywnych zniżek cenowych.)
🚀 Przedstawiamy Logarithmic Framework od LudwigICT 🚀
Wprowadź porządek w chaosie rynku dzięki profesjonalnemu narzędziu do wykresów, zaprojektowanemu dla traderów, którzy wymagają struktury, jasności i precyzji.
✨ Kluczowe funkcje:
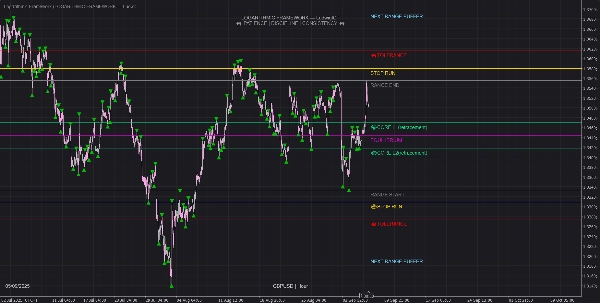
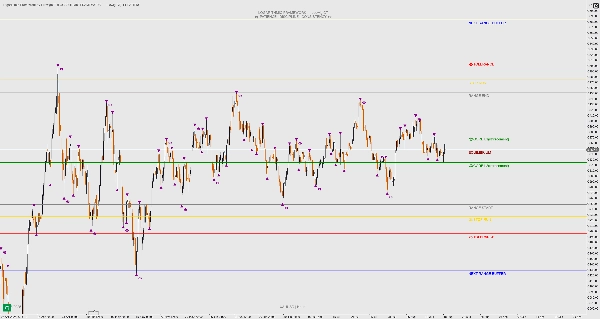
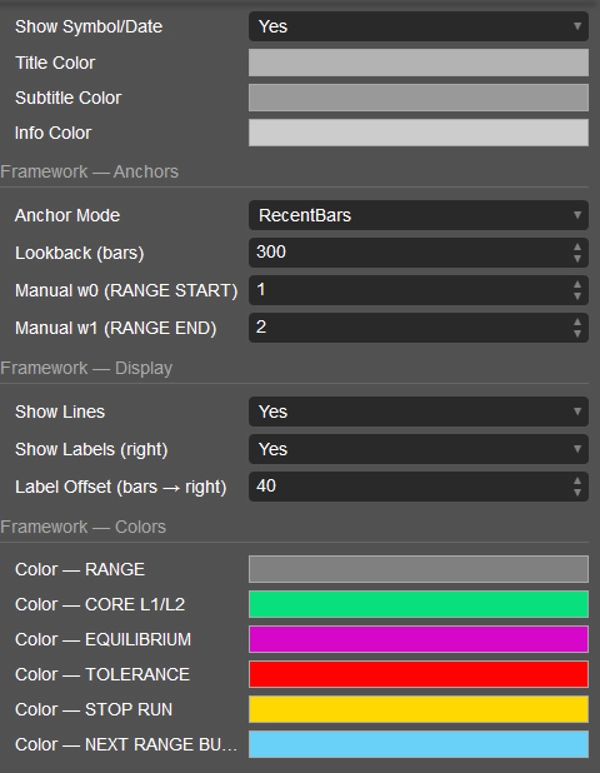
🔹 Siatka Logarithmic Framework – Automatyczne strefy płynności, równowagi i poziomy stop-run odwzorowane z precyzją.
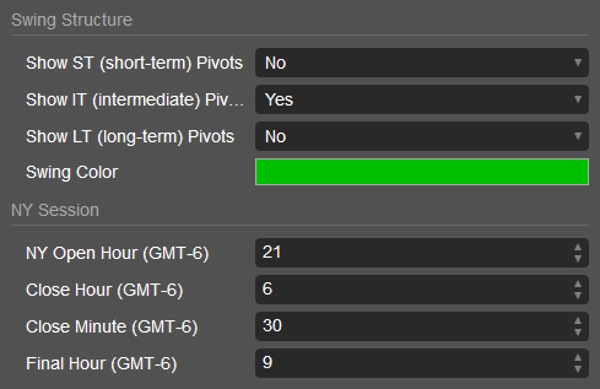
🔹 Wielopoziomowa struktura rynku – Krótkoterminowe, średnioterminowe i długoterminowe punkty zwrotne dla czystej hierarchii ruchu cen.
🔹 Mapowanie sesji nowojorskiej – Prawdziwa linia otwarcia, dzienne maksimum/minimum oraz znaczniki czasu sesji dla handlu w stylu ICT.
🔹 Wizualna elegancja – Znak wodny, dynamiczne etykiety i czysty układ, aby Twoje wykresy były ostre i profesjonalne.
To nie jest tylko wskaźnik – to kompletny framework rynkowy, który pomaga dostrzec ruchy płynności, śledzić zmiany struktury i handlować z pewnością siebie w najważniejszej sesji dnia.
📊 Zaprojektowany dla traderów, którzy chcą jasności zamiast bałaganu.
To narzędzie tworzy mapę struktury cen i stref płynności opartą na frameworku logarytmicznym. Śledzi również strukturę rynku swingowego na różnych poziomach czasowych i nakłada na to dynamikę sesji nowojorskiej. Celem jest pomoc w wizualnym dopasowaniu się do wyższej rangi struktury cen i poziomów płynności, przy jednoczesnym utrzymaniu wykresu w porządku i spójności.
Jeśli masz jakiekolwiek pytania lub napotkasz problemy, śmiało skontaktuj się ze mną. Chętnie pomogę!
Zastrzeżenie:
Korzystając z moich algorytmów, przyjmujesz do wiadomości, że handel wiąże się z ryzykiem i że wyniki historyczne nie gwarantują przyszłych rezultatów. Niezbędne jest posiadanie solidnej strategii zarządzania ryzykiem i, co najważniejsze, dyscypliny w przestrzeganiu poziomów stop-loss. Nieprawidłowe zarządzanie ryzykiem może prowadzić do znacznych strat. Nie ponoszę odpowiedzialności za jakiekolwiek skutki finansowe wynikające z używania tych algorytmów. Handluj odpowiedzialnie i zawsze stosuj właściwe praktyki zarządzania ryzykiem.
Błogosławieństwo! 🙌
Podsumowanie
Opinie klientów
5 | 67 % | |
4 | 33 % | |
3 | 0 % | |
2 | 0 % | |
1 | 0 % |


