
Mô tả
Chúng tôi đã chuyển sang 👉 PrimeQuant
🚫🚫🚫 Đừng mua chỉ báo này!
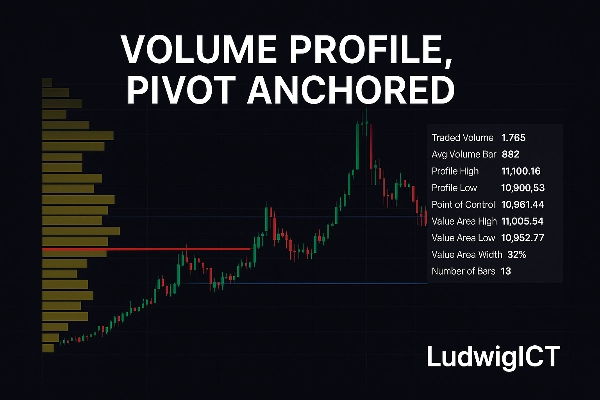
Chỉ báo Volume Profile, Pivot Anchored mang đến một phương pháp phân tích cấu trúc thị trường và khối lượng chuyên nghiệp trực tiếp vào cTrader. Được thiết kế cho các nhà giao dịch coi trọng sự rõ ràng, chính xác và những hiểu biết có thể hành động, nó tiết lộ cách hoạt động giao dịch được phân bổ theo giá trong các phạm vi swing có ý nghĩa.
⚡Ưu đãi độc quyền – Giới hạn cho 10 người mua đầu tiên!⚡
Mở khóa toàn bộ tiềm năng của chiến lược giao dịch của bạn với chỉ báo tùy chỉnh mạnh mẽ này, được thiết kế để mang lại cho bạn lợi thế chính xác trên thị trường. Công cụ này được tạo ra cho các nhà giao dịch nghiêm túc muốn có tín hiệu rõ ràng, có thể hành động và cải thiện quyết định khi giao dịch XAU/USD và các cặp Forex khác.
🚀 Tại sao nên lấy ngay bây giờ:
Có sẵn với giá khởi động đặc biệt – chỉ dành cho 10 nhà giao dịch đầu tiên
Truy cập vào những hiểu biết sâu sắc về hành động giá nâng cao
Được xây dựng cho độ chính xác và độ tin cậy cao
Hoàn hảo cho cả giao dịch lướt sóng và giao dịch swing
Khi 10 bản sao được bán, ưu đãi này sẽ không còn có sẵn với mức giá này. Hãy đảm bảo có bản sao của bạn ngay hôm nay và nâng tầm giao dịch của bạn!
Nó làm gì?
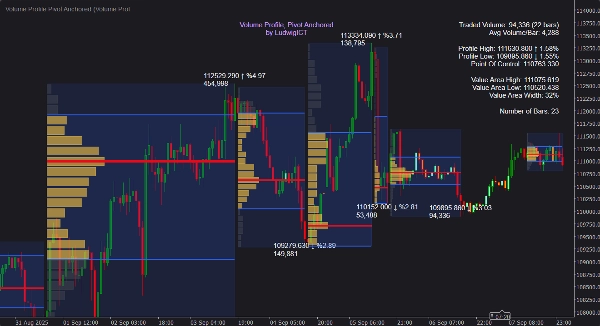
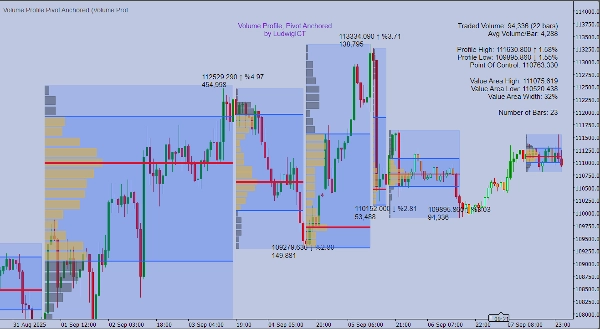
Không giống như các hồ sơ cố định hoặc dựa trên phiên, công cụ này tự động neo các hồ sơ khối lượng vào các điểm pivot cao và thấp quan trọng, lập bản đồ động quá trình đấu giá của mỗi swing. Điều này giúp bạn có thể thấy nơi các thành viên thị trường thực sự cam kết vốn — không chỉ nơi giá di chuyển.
✨ Các yếu tố chính bao gồm:
📍 Phát hiện Pivot tự động – Hồ sơ được xây dựng giữa các điểm swing cao và thấp, cập nhật khi các pivot mới hình thành.
📊 Phân phối khối lượng chi tiết – Biểu đồ cột hiển thị cách khối lượng được phân bổ theo giá, với độ phân giải và chiều rộng do người dùng định nghĩa.
🎯 Các mức Value Area & POC – Tính toán và hiển thị ngay lập tức Điểm Kiểm Soát (POC), Giá Trị Cao (VAH) và Giá Trị Thấp (VAL).
📈 Hồ sơ đang phát triển – Hồ sơ cập nhật trực tiếp trên chân hiện tại cung cấp bối cảnh hướng tới tương lai.
➡️ Mở rộng vùng POC – Dự báo POC về phía trước cho đến khi giá chạm hoặc vượt qua, làm nổi bật các vùng phản ứng trong tương lai.
📝 Nhãn và chú giải thông tin – Nhãn giá, thay đổi %, khối lượng tích lũy và bảng thống kê sạch sẽ khi di chuột.
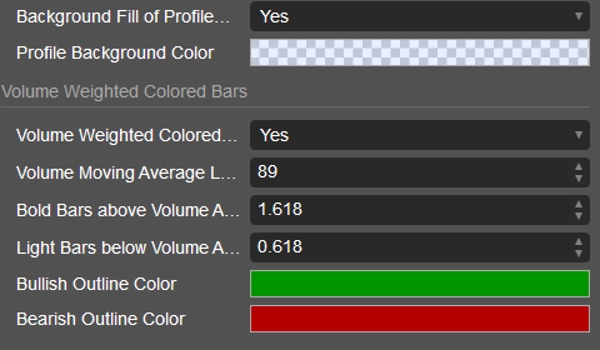
🎨 Tô màu thanh theo khối lượng – Nến được tô bóng theo cường độ khối lượng để nhận dạng mẫu nhanh chóng.
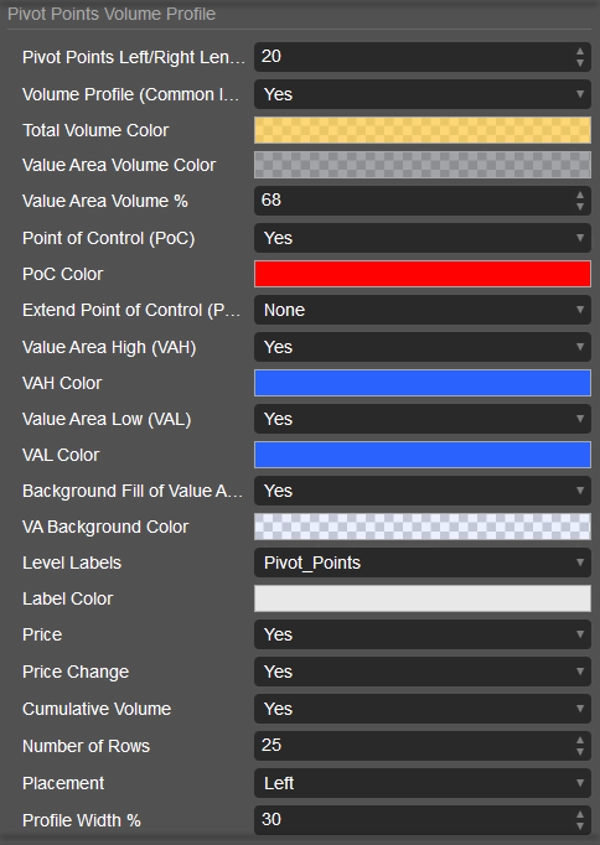
⚙️ Tùy chỉnh đầy đủ – Điều chỉnh màu sắc, vị trí và hiển thị để tích hợp liền mạch với phong cách biểu đồ của bạn.
Cách sử dụng
1️⃣ Gắn vào bất kỳ biểu đồ nào – hoạt động trên tất cả các khung thời gian và công cụ.
2️⃣ Điều chỉnh độ dài pivot – kiểm soát độ nhạy với các điểm swing cao/thấp (ngắn hơn = nhiều hồ sơ hơn, dài hơn = chỉ cấu trúc chính).
3️⃣ Diễn giải hồ sơ trong bối cảnh:
• 🎯 POC – mức giá có khối lượng giao dịch nhiều nhất, thường là nam châm hút.
• 📏 VAH / VAL – ranh giới của vùng giá trị, hỗ trợ/kháng cự mạnh mẽ.
• 🌀 Hình dạng biểu đồ cột – xác định vùng cân bằng, vùng từ chối và sự thay đổi phân phối.
4️⃣ Theo dõi hồ sơ đang phát triển – theo dõi cách cấu trúc đấu giá xây dựng theo thời gian thực.
5️⃣ Sử dụng cảnh báo – nhận thông báo khi giá tương tác với POC, VAH, VAL hoặc khi xuất hiện các thanh có khối lượng lớn.
6️⃣ Áp dụng như một khung làm việc – tinh chỉnh điểm vào tại các mức dựa trên khối lượng, dự đoán đảo chiều và xác nhận xu hướng qua cấu trúc khối lượng.
Tại sao các nhà giao dịch sử dụng nó
Chỉ báo này chuyển đổi khối lượng thô thành cấu trúc có ý nghĩa. Bằng cách neo hồ sơ vào các pivot, nó thích ứng với động lực thị trường trực tiếp thay vì dựa vào các phân chia phiên tùy ý. Dù là giao dịch trong ngày, swing hay vị thế, phân phối khối lượng neo mang lại sự rõ ràng sâu sắc hơn cho việc ra quyết định.
Các tham số chính trong nháy mắt
⚙️ Độ nhạy Pivot – xác định mức độ phát hiện điểm swing.
📊 Mức & chiều rộng hồ sơ – kiểm soát độ phân giải và khả năng hiển thị hồ sơ.
🎯 Chế độ mở rộng POC – Không, đến thanh cuối cùng, đến khi chạm, hoặc đến khi vượt qua.
📏 Phần trăm vùng giá trị – hoàn toàn điều chỉnh được (mặc định 68%).
🎨 Tô màu khối lượng – ngưỡng để làm nổi bật sự tham gia mạnh/yếu.
Volume Profile, Pivot Anchored của LudwigICT không phải là một hình ảnh hóa chung chung — nó là một thấu kính cấu trúc để hiểu cách thị trường thực sự đấu giá. Dành cho các nhà giao dịch yêu cầu công cụ chuyên nghiệp, nó cung cấp lợi thế quyết định trong việc đọc sự tương tác giữa giá và khối lượng.
Nếu bạn có bất kỳ câu hỏi hoặc gặp vấn đề nào, đừng ngần ngại liên hệ với tôi. Tôi rất vui được giúp bạn!
Tuyên bố từ chối trách nhiệm:
Bằng cách sử dụng các thuật toán của tôi, bạn thừa nhận rằng giao dịch có rủi ro vốn có và hiệu suất trong quá khứ không đảm bảo kết quả trong tương lai. Việc có một chiến lược quản lý rủi ro vững chắc là điều thiết yếu và trên hết, bạn phải giữ kỷ luật trong việc tuân thủ các mức dừng lỗ. Việc không quản lý rủi ro đúng cách có thể dẫn đến thua lỗ đáng kể. Tôi không chịu trách nhiệm về bất kỳ kết quả tài chính nào phát sinh từ việc sử dụng các thuật toán này. Hãy giao dịch có trách nhiệm và luôn tuân thủ các thực hành quản lý rủi ro đúng đắn.
Chúc bạn may mắn! 🙌
Tóm tắt
Đánh giá của khách hàng
5 | 67 % | |
4 | 33 % | |
3 | 0 % | |
2 | 0 % | |
1 | 0 % |


