
Mô tả
⚠️ Chúng tôi đã chuyển sang 👉 PrimeQuant
🚫🚫🚫 Đừng mua chỉ báo này!
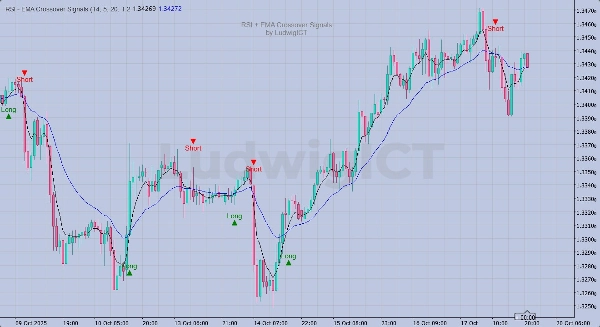
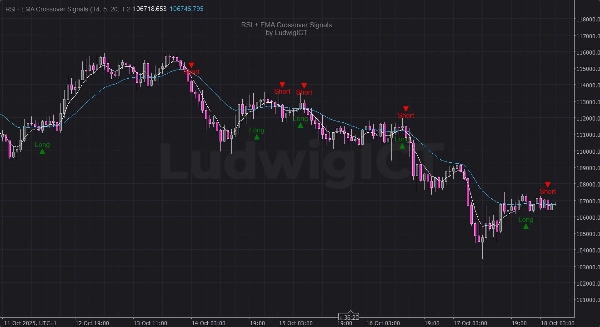
🎯 Tổng quan
Chỉ báo RSI + EMA Crossover Signals của LudwigICT kết hợp đà và xu hướng để tạo ra các tín hiệu giao dịch Mua/Bán với độ tin cậy cao — ngay trên biểu đồ của bạn.
⚙️ Cách hoạt động:
- Giai đoạn Tín hiệu RSI:
-
- Một tín hiệu được kích hoạt khi RSI cắt đường tín hiệu SMA của chính nó.
- Giai đoạn Xác nhận EMA:
-
- Tín hiệu chỉ được kích hoạt khi các EMA nhanh và chậm cắt nhau theo cùng một hướng.
- Hủy tín hiệu:
-
- Bất kỳ sự cắt ngược nào (RSI hoặc EMA) sẽ hủy bỏ tín hiệu chưa được kích hoạt.
✨ Tính năng chính:
- 🔁 Logic xác nhận kép (RSI + EMA)
- 📈 Biểu tượng Mua và Bán rõ ràng được vẽ trực tiếp trên biểu đồ
- ⚡ Độ lệch trực quan dựa trên ATR động (tự động điều chỉnh theo biến động)
- 💧 Lớp phủ sạch với thương hiệu watermark cố định
- 🧠 Logic “kích hoạt” và “hủy bỏ” thông minh để giảm các kích hoạt sai
- 🧮 Tham số RSI, EMA và độ lệch hoàn toàn có thể điều chỉnh
🔧 Đầu vào:
- Chu kỳ RSI (mặc định: 14)
- EMA nhanh (mặc định: 5)
- EMA chậm (mặc định: 20)
- Độ lệch tín hiệu (hệ số nhân ATR, mặc định: 1.2)
📊 Phù hợp cho:
- Nhà giao dịch theo đà
- Hệ thống xác nhận xu hướng
- Chiến lược giao dịch thủ công hoặc bán tự động
📅 Cập nhật phiên bản:
- ✅ Thêm độ lệch động dựa trên ATR để hình ảnh rõ ràng hơn
- ✅ Cải thiện logic độ chính xác tín hiệu
- ✅ Thêm watermark không thể gỡ bỏ để đảm bảo tính xác thực
© 2025 LudwigICT — Bảo lưu mọi quyền.
Nếu bạn có bất kỳ câu hỏi hoặc gặp phải vấn đề nào, hãy liên hệ với tôi. Tôi rất vui được giúp bạn!
Tuyên bố từ chối trách nhiệm:
Bằng cách sử dụng các thuật toán của tôi, bạn thừa nhận rằng giao dịch có những rủi ro vốn có và hiệu suất trong quá khứ không đảm bảo kết quả trong tương lai. Việc có một chiến lược quản lý rủi ro vững chắc là điều cần thiết và trên hết, bạn phải luôn kỷ luật tuân thủ các mức dừng lỗ. Việc không quản lý rủi ro đúng cách có thể dẫn đến tổn thất đáng kể. Tôi không chịu trách nhiệm về bất kỳ kết quả tài chính nào phát sinh từ việc sử dụng các thuật toán này. Hãy giao dịch có trách nhiệm và luôn tuân theo các thực hành quản lý rủi ro đúng đắn.
Chúc bạn thành công! 🙌
Tóm tắt
Đánh giá của khách hàng
5 | 0 % | |
4 | 100 % | |
3 | 0 % | |
2 | 0 % | |
1 | 0 % |


