
Opis
Przenieśliśmy się do 👉 PrimeQuant
🚫🚫🚫 Nie kupuj tego wskaźnika!
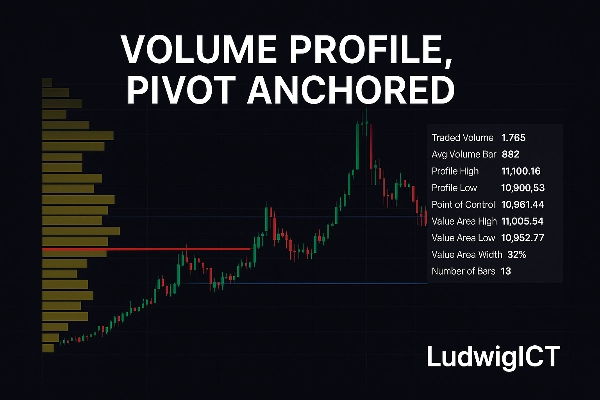
Wskaźnik Volume Profile, Pivot Anchored wprowadza profesjonalne podejście do analizy struktury rynku i wolumenu bezpośrednio do cTrader. Zaprojektowany dla traderów ceniących jasność, precyzję i praktyczne wskazówki, ujawnia, jak aktywność handlowa jest rozłożona w cenie w ramach istotnych zakresów swingów.
⚡Ekskluzywna oferta – ograniczona do pierwszych 10 nabywców!⚡
Odblokuj pełny potencjał swojej strategii handlowej dzięki temu potężnemu własnemu wskaźnikowi, zaprojektowanemu, by dać Ci precyzyjną przewagę na rynku. To narzędzie zostało stworzone dla poważnych traderów, którzy chcą jasnych, praktycznych sygnałów i lepszego podejmowania decyzji podczas handlu XAU/USD i innymi parami Forex.
🚀 Dlaczego warto go mieć już teraz:
Dostępny w specjalnej cenie startowej – tylko dla pierwszych 10 traderów
Uzyskaj dostęp do zaawansowanych informacji o ruchach cen
Stworzony z myślą o wysokiej dokładności i niezawodności
Idealny zarówno do scalpowania, jak i swing tradingu
Po sprzedaży 10 kopii ta oferta nie będzie już dostępna w tej cenie. Zabezpiecz swoją kopię już dziś i wynieś swój trading na wyższy poziom!
Co robi?
W przeciwieństwie do profili stałych lub sesyjnych, to narzędzie automatycznie kotwiczy profile wolumenu do istotnych pivotów wysokich i niskich, dynamicznie mapując proces aukcji każdego swingu. Dzięki temu można zobaczyć, gdzie uczestnicy rynku faktycznie zaangażowali kapitał — nie tylko gdzie cena się poruszyła.
✨ Kluczowe elementy obejmują:
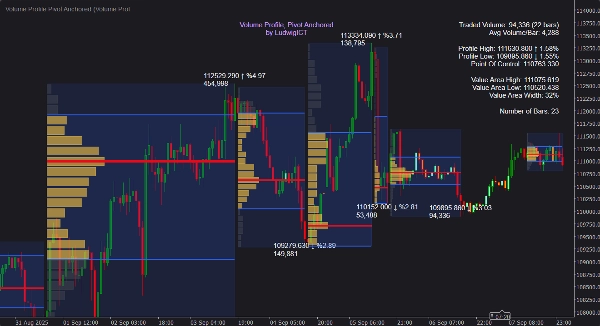
📍 Automatyczne wykrywanie pivotów – profile budowane są między swingowymi szczytami i dołkami, aktualizując się wraz z powstawaniem nowych pivotów.
📊 Szczegółowa dystrybucja wolumenu – histogramy pokazują, jak wolumen jest rozłożony w cenie, z rozdzielczością i szerokością definiowaną przez użytkownika.
🎯 Poziomy Value Area i POC – natychmiastowe obliczanie i wizualizacja Punktu Kontroli (POC), Wysokiego Poziomu Value Area (VAH) i Niskiego Poziomu Value Area (VAL).
📈 Profil rozwijający się – na bieżąco aktualizowany profil na obecnej nodze zapewnia perspektywiczny kontekst.
➡️ Rozszerzanie stref POC – projekcja POC do przodu aż do momentu dotknięcia lub przekroczenia przez cenę, podkreślająca przyszłe strefy reakcji.
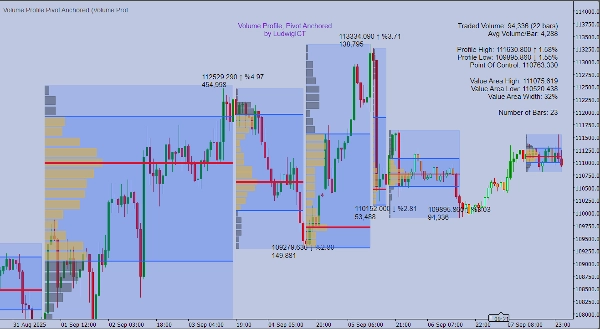
📝 Informacyjne etykiety i podpowiedzi – etykiety cen, zmiana %, skumulowany wolumen oraz czysty panel statystyczny po najechaniu kursorem.
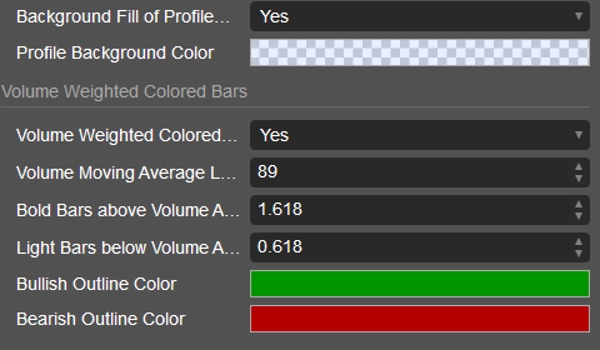
🎨 Kolorowanie świec według wolumenu – świece cieniowane intensywnością wolumenu dla szybkiego rozpoznawania wzorców.
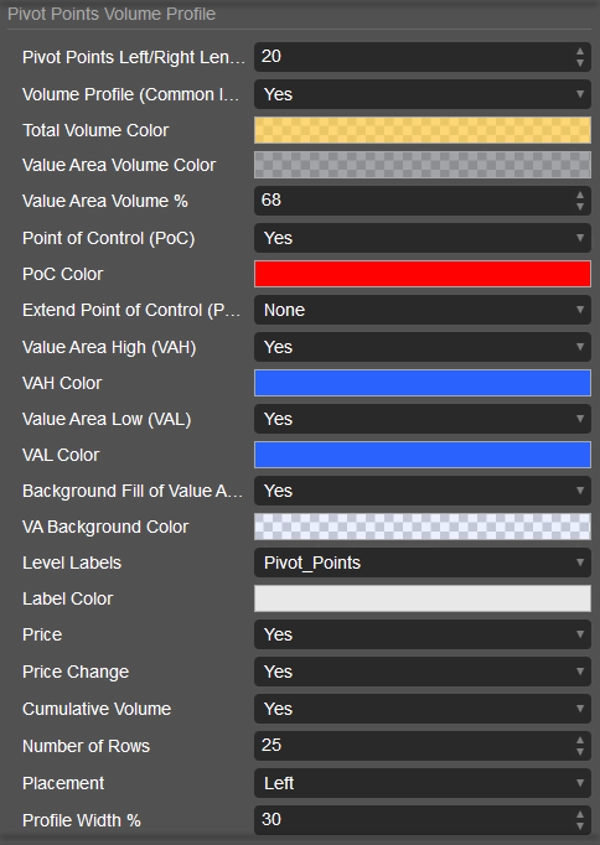
⚙️ Pełna personalizacja – dostosuj kolory, położenie i wyświetlanie, aby idealnie wpasować się w styl wykresu.
Jak używać
1️⃣ Dołącz do dowolnego wykresu – działa na wszystkich interwałach i instrumentach.
2️⃣ Dostosuj długość pivotu – kontroluj czułość na swingowe szczyty/dołki (krótsza = więcej profili, dłuższa = tylko główna struktura).
3️⃣ Interpretuj profile w kontekście:
• 🎯 POC – poziom cenowy z największym wolumenem obrotu, często działa jak magnes.
• 📏 VAH / VAL – granice obszaru wartości, silne wsparcie/opór.
• 🌀 Kształt histogramu – identyfikuj obszary równowagi, strefy odrzutu i zmiany dystrybucji.
4️⃣ Obserwuj rozwijający się profil – śledź, jak struktura aukcji buduje się w czasie rzeczywistym.
5️⃣ Korzystaj z alertów – otrzymuj powiadomienia, gdy cena wchodzi w interakcję z POC, VAH, VAL lub gdy pojawiają się świece o dużym wolumenie.
6️⃣ Stosuj jako ramy – dopracuj wejścia na poziomach opartych na wolumenie, przewiduj odwrócenia i potwierdzaj trendy przez strukturę wolumenu.
Dlaczego traderzy go używają
Ten wskaźnik przekłada surowy wolumen na znaczącą strukturę. Kotwicząc profile do pivotów, dostosowuje się do dynamicznego rynku na żywo, zamiast polegać na arbitralnych podziałach sesji. Niezależnie od tego, czy handlujesz intraday, swing czy pozycjonujesz się, zakotwiczona dystrybucja wolumenu zapewnia głębszą jasność w podejmowaniu decyzji.
Kluczowe parametry w skrócie
⚙️ Czułość pivotów – definiuj, jak agresywnie wykrywane są punkty swingowe.
📊 Poziomy i szerokość profilu – kontroluj rozdzielczość i widoczność profilu.
🎯 Tryby rozszerzania POC – brak, do ostatniej świecy, do dotknięcia lub do przekroczenia.
📏 Procent obszaru wartości – w pełni regulowany (domyślnie 68%).
🎨 Kolorowanie wolumenu – progi do wyróżniania silnego/słabego udziału.
Volume Profile, Pivot Anchored autorstwa LudwigICT to nie jest zwykła wizualizacja — to strukturalna soczewka pokazująca, jak rynki naprawdę działają. Dla traderów wymagających profesjonalnych narzędzi, zapewnia decydującą przewagę w czytaniu interakcji między ceną a wolumenem.
Jeśli masz jakiekolwiek pytania lub napotkasz problemy, śmiało skontaktuj się ze mną. Chętnie pomogę!
Zastrzeżenie:
Korzystając z moich algorytmów, przyjmujesz do wiadomości, że handel wiąże się z ryzykiem i że wyniki historyczne nie gwarantują przyszłych rezultatów. Niezbędne jest posiadanie solidnej strategii zarządzania ryzykiem i, co najważniejsze, dyscypliny w przestrzeganiu poziomów stop-loss. Nieprawidłowe zarządzanie ryzykiem może prowadzić do znacznych strat. Nie ponoszę odpowiedzialności za jakiekolwiek skutki finansowe wynikające z użycia tych algorytmów. Handluj odpowiedzialnie i zawsze stosuj właściwe praktyki zarządzania ryzykiem.
Błogosławieństwa! 🙌
Podsumowanie
Opinie klientów
5 | 67 % | |
4 | 33 % | |
3 | 0 % | |
2 | 0 % | |
1 | 0 % |


