
Açıklama
⚠️ Taşındık 👉 PrimeQuant
🚫🚫🚫 Bu göstergeden satın almayın!
⚡ YENİ NESİL SÜRÜM MEVCUT: Bu klasik LudwigICT aracı yeniden tasarlandı, yapılandırıldı ve yeni geliştirici markamız altında yeniden yayınlandı, PrimeQuant. Yeni sürüm, güncel piyasa koşulları için sadeleştirilmiş bir kullanıcı arayüzü ve güncellenmiş özellikler sunar. İyileştirilmiş sürümü indirimli fiyatla buradan edinin:
👉 ALMA-Gaussian Trend Filter
👉 ALMA-Gaussian Trend Filter
👉 ALMA-Gaussian Trend Filter
(Lütfen not edin: LudwigICT listesi eski kullanıcılar için aktif kalmaya devam edecek ancak artık güncelleme veya aktif fiyat indirimleri almayacaktır.)
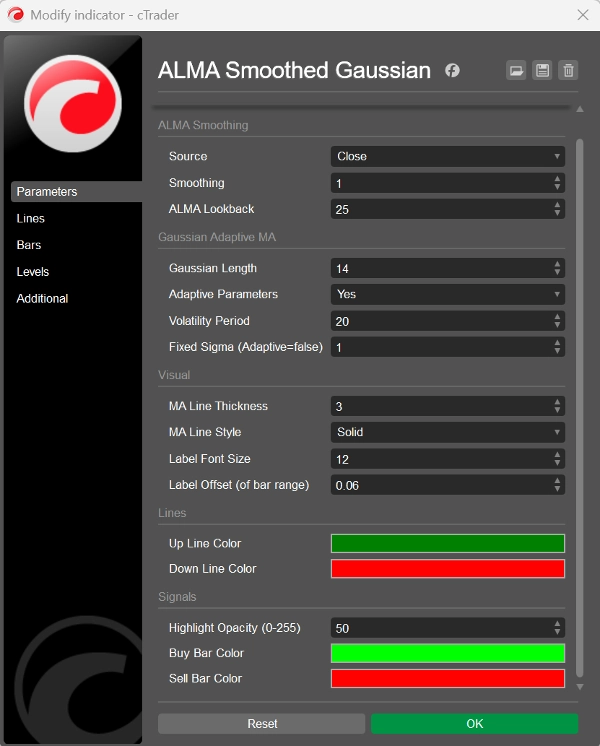
ALMA Düzgünleştirilmiş Gaussian Hareketli Ortalama (ASGMA) – LudwigICT tarafından
Bir kesin trend takip göstergesi, ALMA düzgünleştirmesi ile uyarlanabilir Gaussian Hareketli Ortalama’yı birleştirerek gürültüyü keser ve gerçek piyasa eğilimini ortaya çıkarır.
🔹 Nasıl çalışır:
- Seçtiğiniz fiyat kaynağını alır (Kapanış, Açılış, Yüksek, Düşük, HL2, HLC3, OHLC4).
- Yüzde değişimi ölçer ve ALMA (Arnaud Legoux MA) ile düzgünleştirir.
- İnceltilmiş bir trend çizgisi için volatiliteye uyarlanabilir veya sabit olan bir Gaussian filtresi uygular.
- Hassas hizalama için kapanışın EMA'sını (7) kullanarak yönü doğrular.
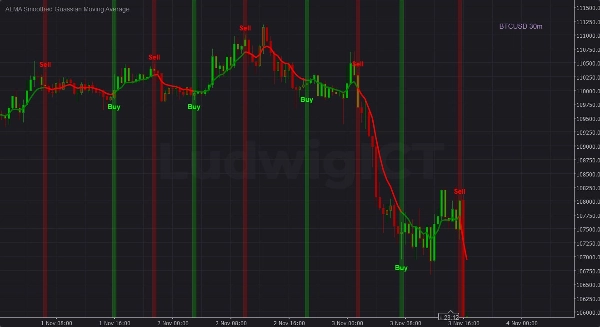
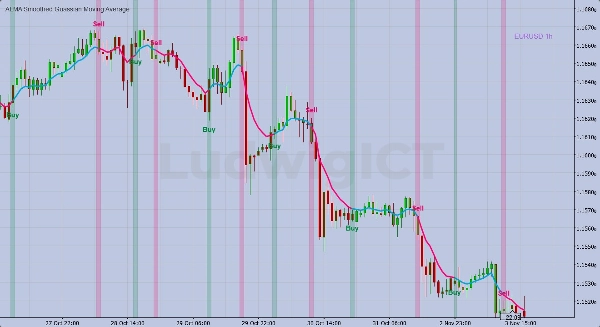
🔹 Grafikte gördükleriniz:
- Trend çizgisi: Yeşil = yükselen trend, Kırmızı = düşen trend.
- Mumlar yeniden renklendirildi: Anında eğilim tanıma için trendle uyumlu gövde ve fitil renkleri.
- Al/Sat sinyalleri: ALMA, Gaussian MA'nın üzerine/aşağı kesildiğinde vurgulanan çubuklar + kalın etiketler.
- Tam yükseklikte vurgular: Kaydırma/zoom sırasında görünür kalır (kaçırılan sinyal yok).
🔹 Tüccarlara sağladığı faydalar:
✅ Temiz, gecikmesiz bir trend haritası
✅ Momentum değişimlerinde hızlı Al/Sat sinyalleri
✅ Daha az grafik karmaşası, işlemde daha fazla güven
👉 Kısaca: Gürültüyü filtreleyen, volatiliteye uyum sağlayan ve net görsel Al/Sat sinyalleri veren kesin bir trend göstergesidir.
Herhangi bir sorunuz varsa veya herhangi bir sorunla karşılaşırsanız, benimle iletişime geçmekten çekinmeyin. Size yardımcı olmaktan mutluluk duyarım!
Feragatname:
Algoritmalarımı kullanarak, ticaretin doğasında riskler olduğunu ve geçmiş performansın gelecekteki sonuçları garanti etmediğini kabul etmiş olursunuz. Sağlam bir risk yönetimi stratejisine sahip olmanız ve her şeyden önce stop-loss seviyelerine disiplinli bir şekilde uymanız çok önemlidir. Riskin doğru yönetilmemesi önemli kayıplara yol açabilir. Bu algoritmaların kullanımı sonucu oluşabilecek finansal sonuçlardan ben sorumlu değilim. Sorumlu bir şekilde işlem yapın ve her zaman uygun risk yönetimi uygulamalarını takip edin.
Hayırlı işler! 🙌
Özet
Müşteri değerlendirmeleri
5 | 33 % | |
4 | 67 % | |
3 | 0 % | |
2 | 0 % | |
1 | 0 % |


