
Açıklama
⚠️ Taşındık 👉 PrimeQuant
🚫🚫🚫 Bu göstergeleri satın almayın!
⚡ GELECEK NESİL SÜRÜM MEVCUT: Bu klasik LudwigICT aracı yeniden tasarlandı, yapılandırıldı ve yeni geliştirici markamız altında tekrar yayınlandı, PrimeQuant. Yeni sürüm, güncel piyasa koşulları için sadeleştirilmiş bir kullanıcı arayüzü ve güncellenmiş özellikler sunuyor. İyileştirilmiş sürümü indirimli fiyatla buradan edinin:
👉 PrimeQuant tarafından Breakout Channels
👉 PrimeQuant tarafından Breakout Channels
👉 PrimeQuant tarafından Breakout Channels
(Lütfen not edin: LudwigICT listesi eski kullanıcılar için aktif kalmaya devam edecek ancak artık güncelleme veya aktif fiyat indirimleri almayacaktır.)
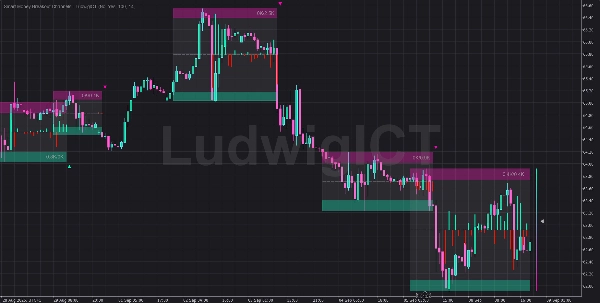
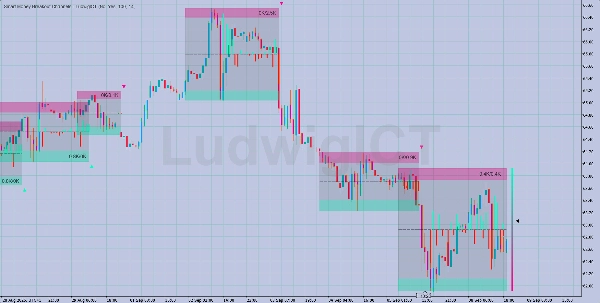
Daha önce hiç olmadığı gibi yüksek olasılıklı breakout bölgelerini keşfedin.
Smart Money Breakout Channels göstergesi, fiyat hareketi, volatilite ve hacim analizini cTrader için güçlü bir görselleştirme aracında birleştirir.
🚀 Temel Özellikler
- Otomatik Breakout Tespiti → Hemen yükseliş ve düşüş kanal bölgelerini vurgular.
- Akıllı Kanal Kutuları → Temiz bir grafik görünümü için şeffaf renk kodlaması.
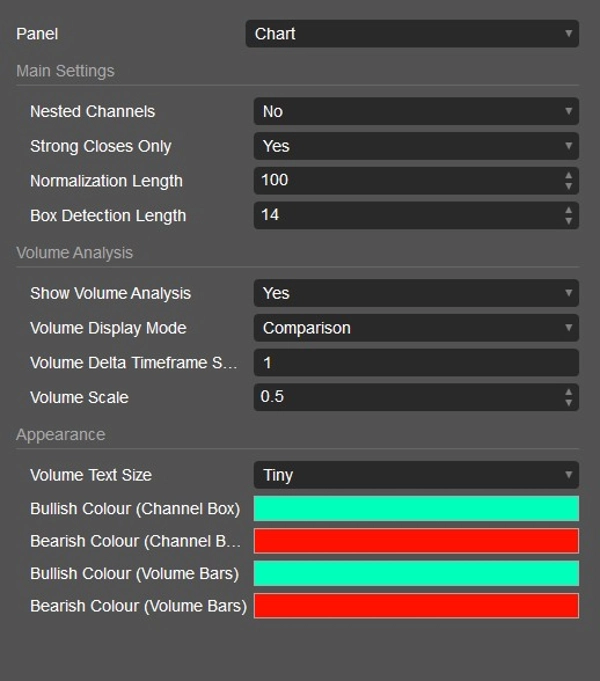
- Hacim Zekası → Üst üste bindirme modları: ham, alım vs satım veya delta hacmi.
- Dinamik Orta Hat Takibi → Gelişen piyasa yapısına uyum sağlar.
- Breakout Sinyalleri → ▲ Yükseliş / ▼ Düşüş okları otomatik olarak görünür.
- Tam Özelleştirme → Hassasiyet, renkler, hacim ölçeklendirme ve metin boyutu.
- İç İçe Kanallar → Daha derin analiz için örtüşen yapıları inceleyin.
- Profesyonel Tasarım → Her zoom seviyesinde optimize edilmiş görseller.
🎯 Tüccarların Sevme Nedenleri
- Manuel kanal çizmeden breakout fırsatlarını belirleyin.
- Daha keskin ticaret kararları için fiyat + hacmi birleştirin.
- Zaman kazanın, otomatik ve sezgisel bir görüntüleme ile.
- Forex, endeksler ve CFD'lerde sorunsuz çalışır.
✅ Mükemmel Kullanım Alanları
- Gün içi, swing ve pozisyon traderları.
- Hacim bilgisine dayalı breakout kurulumlarına güvenen traderlar.
- Akıllı para kavramları için profesyonel düzeyde bir görselleştirme aracı arayan herkes.
⚡ Sadece grafiğinize ekleyin, tarzınıza göre özelleştirin ve Smart Money Breakout Channels en önemli breakout bölgelerini ortaya çıkarsın.
Herhangi bir sorunuz veya sorun yaşamanız durumunda benimle iletişime geçmekten çekinmeyin. Size yardımcı olmaktan mutluluk duyarım!
Feragatname:
Algoritmalarımı kullanarak, ticaretin doğasında riskler olduğunu ve geçmiş performansın gelecekteki sonuçları garanti etmediğini kabul etmiş olursunuz. Sağlam bir risk yönetimi stratejisine sahip olmanız ve her şeyden önce stop-loss seviyelerine disiplinli bir şekilde uymanız çok önemlidir. Riskleri doğru yönetememek önemli kayıplara yol açabilir. Bu algoritmaların kullanımı sonucu oluşabilecek finansal sonuçlardan ben sorumlu değilim. Sorumlu bir şekilde ticaret yapın ve her zaman uygun risk yönetimi uygulamalarını takip edin.
Hayırlı işler! 🙌
Özet
Müşteri değerlendirmeleri
5 | 100 % | |
4 | 0 % | |
3 | 0 % | |
2 | 0 % | |
1 | 0 % |


