
Açıklama
Taşındık 👉 PrimeQuant
🚫🚫🚫 Bu göstergeleri satın almayın!
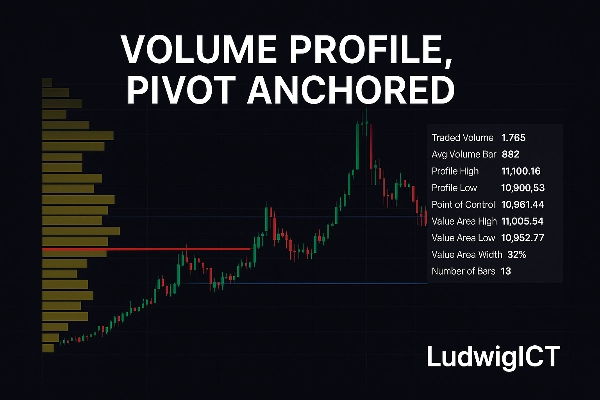
Volume Profile, Pivot Anchored göstergesi, profesyonel düzeyde piyasa yapısı ve hacim analizini doğrudan cTrader'a getirir. Açıklık, hassasiyet ve uygulanabilir içgörülere değer veren traderlar için tasarlanmıştır; işlem faaliyetinin anlamlı salınım aralıkları içinde fiyat boyunca nasıl dağıldığını ortaya koyar.
⚡Özel Teklif – İlk 10 Alıcı ile Sınırlıdır!⚡
Bu güçlü özel gösterge ile işlem stratejinizin tam potansiyelini açığa çıkarın; piyasada size kesin bir avantaj sağlamak için tasarlanmıştır. Bu araç, net, uygulanabilir sinyaller ve XAU/USD ve diğer Forex çiftlerinde işlem yaparken gelişmiş karar verme için ciddi traderlar için hazırlanmıştır.
🚀 Neden Şimdi Almalısınız:
Sadece ilk 10 trader için geçerli olan özel lansman fiyatı ile sunulmaktadır.
Gelişmiş fiyat hareketi içgörülerine erişim kazanın.
Yüksek doğruluk ve güvenilirlik için tasarlanmıştır.
Hem scalping hem de swing trading için mükemmeldir.
10 kopya satıldıktan sonra, bu teklif bu fiyattan artık geçerli olmayacaktır. Kopyanızı bugün güvence altına alın ve işlemlerinizi bir üst seviyeye taşıyın!
Ne Yapar?
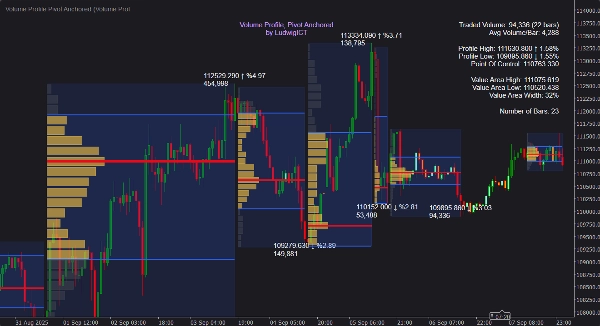
Sabit veya oturum bazlı profillerin aksine, bu araç hacim profillerini otomatik olarak önemli pivot yükseklerine ve düşüklerine bağlar, her salınımın açık artırma sürecini dinamik olarak haritalar. Bu, piyasa katılımcılarının gerçekten nerede sermaye taahhüt ettiğini görmeyi mümkün kılar — sadece fiyatın hareket ettiği yer değil.
✨ Temel öğeler şunları içerir:
📍 Otomatik Pivot Tespiti – Profiller, salınım yüksekleri ve düşükleri arasında oluşturulur, yeni pivotlar oluştuğunda güncellenir.
📊 Ayrıntılı Hacim Dağılımı – Histogramlar, hacmin fiyat boyunca nasıl dağıldığını kullanıcı tanımlı çözünürlük ve genişlik ile gösterir.
🎯 Değer Alanı & POC Seviyeleri – Kontrol Noktası (POC), Değer Alanı Yüksek (VAH) ve Değer Alanı Düşük (VAL) anında hesaplanır ve görselleştirilir.
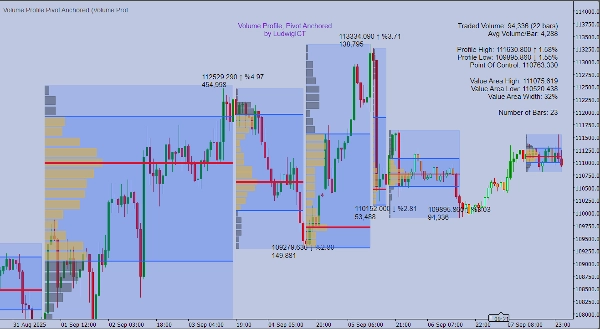
📈 Gelişen Profil – Mevcut bacakta canlı güncellenen profil, ileriye dönük bağlam sağlar.
➡️ POC Bölgelerinin Uzatılması – POC'yi fiyat tarafından dokunulana veya geçilene kadar ileriye projekte eder, gelecekteki tepki bölgelerini vurgular.
📝 Bilgilendirici Etiketler & İpuçları – Fiyat etiketleri, % değişim, kümülatif hacim ve üzerine gelindiğinde temiz bir istatistik paneli.
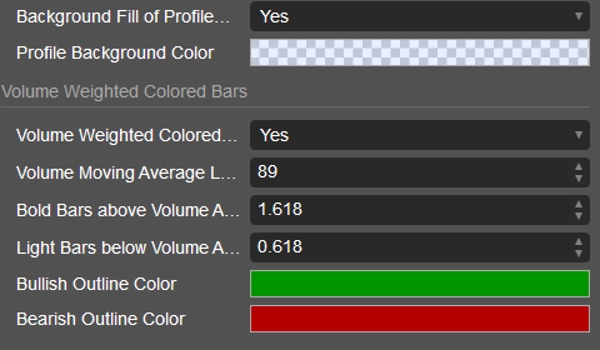
🎨 Hacim Ağırlıklı Mum Renkleri – Mumlar, hızlı desen tanıma için hacim yoğunluğuna göre gölgelendirilir.
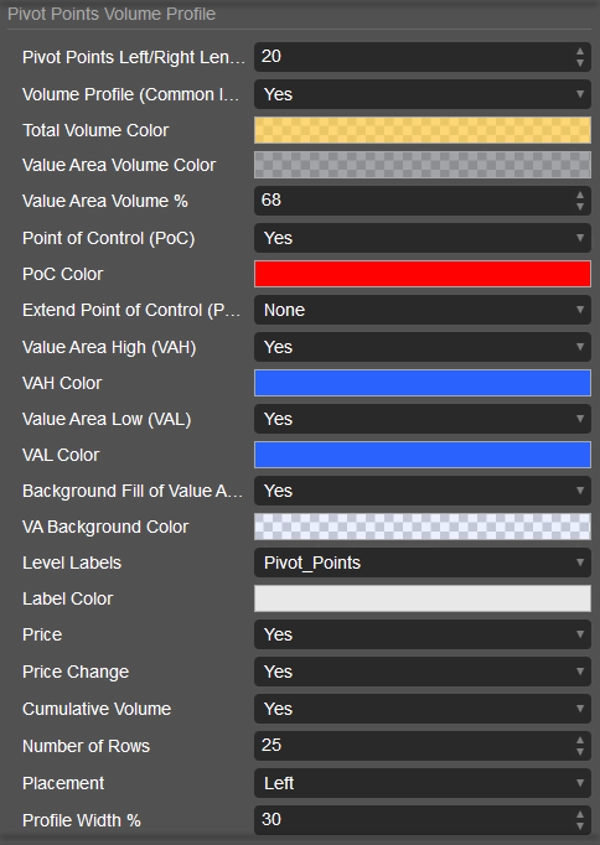
⚙️ Tam Özelleştirme – Renkleri, yerleşimi ve görüntüyü ayarlayarak grafiğinizin stiline sorunsuz entegrasyon sağlar.
Nasıl Kullanılır
1️⃣ Herhangi bir grafiğe ekleyin – tüm zaman dilimleri ve enstrümanlarda çalışır.
2️⃣ Pivot uzunluğunu ayarlayın – salınım yüksek/düşüklerine duyarlılığı kontrol edin (kısa = daha fazla profil, uzun = sadece ana yapı).
3️⃣ Profilleri bağlam içinde yorumlayın:
• 🎯 POC – en çok işlem gören hacme sahip fiyat seviyesi, genellikle bir mıknatıs.
• 📏 VAH / VAL – değer alanının sınırları, güçlü destek/direnç.
• 🌀 Histogram Şekli – denge alanlarını, reddetme bölgelerini ve dağılım değişimlerini tanımlayın.
4️⃣ Gelişen profili izleyin – açık artırma yapısının gerçek zamanlı nasıl oluştuğunu takip edin.
5️⃣ Uyarıları kullanın – fiyat POC, VAH, VAL ile etkileşime girdiğinde veya yüksek hacimli mumlar göründüğünde bildirim alın.
6️⃣ Bir çerçeve olarak uygulayın – hacim bazlı seviyelerde girişleri iyileştirin, dönüşleri tahmin edin ve hacim yapısı ile trendleri doğrulayın.
Neden Traderlar Kullanır
Bu gösterge ham hacmi anlamlı yapıya dönüştürür. Profilleri pivotlara bağlayarak, keyfi oturum bölünmelerine dayanmak yerine canlı piyasa dinamiklerine uyum sağlar. İster günlük, ister salınım, ister pozisyonel işlem yapıyor olun, bağlı hacim dağılımı karar verme için daha derin bir açıklık sunar.
Önemli Parametrelere Genel Bakış
⚙️ Pivot Hassasiyeti – salınım noktalarının ne kadar agresif tespit edileceğini tanımlayın.
📊 Profil Seviyeleri & Genişlik – profil çözünürlüğünü ve görünürlüğünü kontrol edin.
🎯 POC Uzatma Modları – Yok, son bara kadar, dokunulana kadar veya geçilene kadar.
📏 Değer Alanı % – tamamen ayarlanabilir (varsayılan %68).
🎨 Hacim Renklendirme – güçlü/zayıf katılımı vurgulamak için eşik değerleri.
LudwigICT tarafından geliştirilen Volume Profile, Pivot Anchored, genel bir görselleştirme değildir — piyasaların gerçekten nasıl açık artırma yaptığını gösteren yapısal bir mercektir. Profesyonel araçlar talep eden traderlar için, fiyat ve hacim arasındaki etkileşimi okumada belirleyici bir avantaj sağlar.
Herhangi bir sorunuz varsa veya herhangi bir sorunla karşılaşırsanız, benimle iletişime geçmekten çekinmeyin. Size yardımcı olmaktan mutluluk duyarım!
Feragatname:
Algoritmalarımı kullanarak, işlemlerin doğasında riskler olduğunu ve geçmiş performansın gelecekteki sonuçları garanti etmediğini kabul etmiş olursunuz. Sağlam bir risk yönetimi stratejisine sahip olmanız ve en önemlisi stop-loss seviyelerine disiplinli bir şekilde uymanız gereklidir. Riskin doğru yönetilmemesi önemli kayıplara yol açabilir. Bu algoritmaların kullanımı sonucu oluşabilecek finansal sonuçlardan ben sorumlu değilim. Sorumlu bir şekilde işlem yapın ve her zaman uygun risk yönetimi uygulamalarını takip edin.
Hayırlı işler! 🙌
Özet
Müşteri değerlendirmeleri
5 | 67 % | |
4 | 33 % | |
3 | 0 % | |
2 | 0 % | |
1 | 0 % |


