
Açıklama
⚠️ Taşındık 👉 PrimeQuant
🚫🚫🚫 Bu göstergeden satın almayın!
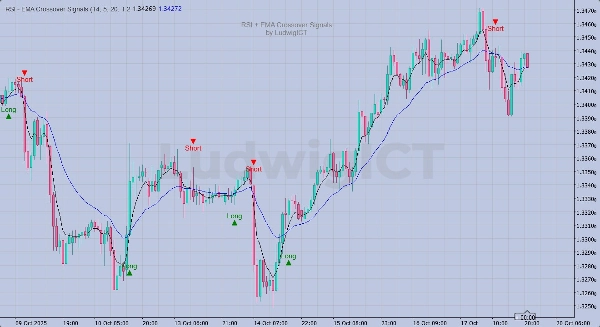
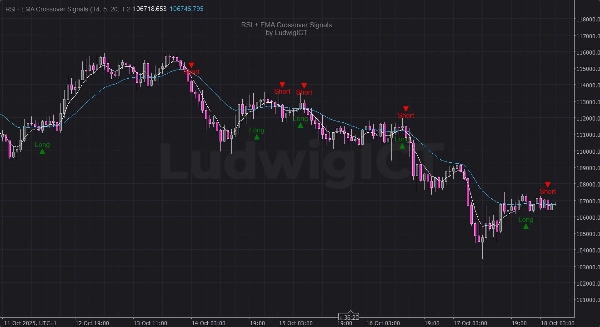
🎯 Genel Bakış
RSI + EMA Kesişim Sinyalleri göstergesi LudwigICT tarafından, momentum ve trend onayı birleştirerek yüksek güvenilirlikte Uzun/Kısa işlem sinyalleri üretir — doğrudan grafiğinizde.
⚙️ Nasıl Çalışır:
- RSI Sinyal Aşaması:
-
- RSI kendi SMA sinyal çizgisini geçtiğinde bir sinyal hazırlanır.
- EMA Onay Aşaması:
-
- Sinyal, hızlı ve yavaş EMA'lar aynı yönde kesiştiğinde tetiklenir.
- Sinyal İptali:
-
- Herhangi bir ters kesişim (RSI veya EMA) tetiklenmemiş sinyali iptal eder.
✨ Temel Özellikler:
- 🔁 Çift onay mantığı (RSI + EMA)
- 📈 Grafik üzerinde doğrudan çizilen net Uzun ve Kısa simgeleri
- ⚡ Dinamik ATR tabanlı görsel kaydırmalar (volatiliteye otomatik uyum)
- 💧 Kalıcı filigran markalama ile temiz kaplama
- 🧠 Yanlış tetiklemeleri azaltmak için akıllı “hazırlama” ve “iptal” mantığı
- 🧮 Tamamen ayarlanabilir RSI, EMA ve kaydırma parametreleri
🔧 Girdiler:
- RSI Periyodu (varsayılan: 14)
- Hızlı EMA (varsayılan: 5)
- Yavaş EMA (varsayılan: 20)
- Sinyal Kaydırması (ATR çarpanı, varsayılan: 1.2)
📊 İdeal Kullanım Alanları:
- Momentum yatırımcıları
- Trend onay sistemleri
- Manuel veya yarı otomatik işlem stratejileri
📅 Sürüm Güncellemeleri:
- ✅ Daha net görseller için ATR tabanlı dinamik kaydırma eklendi
- ✅ Sinyal doğruluk mantığı geliştirildi
- ✅ Gerçeklik için kaldırılamayan filigran eklendi
© 2025 LudwigICT — Tüm Hakları Saklıdır.
Herhangi bir sorunuz veya sorun yaşamanız durumunda benimle iletişime geçmekten çekinmeyin. Size yardımcı olmaktan mutluluk duyarım!
Feragatname:
Algoritmalarımı kullanarak, işlemlerin doğasında riskler bulunduğunu ve geçmiş performansın gelecekteki sonuçları garanti etmediğini kabul etmiş olursunuz. Sağlam bir risk yönetimi stratejisine sahip olmanız ve her şeyden önce stop-loss seviyelerine disiplinli bir şekilde uymanız çok önemlidir. Riskin doğru yönetilmemesi önemli kayıplara yol açabilir. Bu algoritmaların kullanımı sonucu oluşabilecek finansal sonuçlardan ben sorumlu değilim. Sorumlu bir şekilde işlem yapın ve her zaman uygun risk yönetimi uygulamalarını takip edin.
Hayırlı olsun! 🙌
Özet
Müşteri değerlendirmeleri
5 | 0 % | |
4 | 100 % | |
3 | 0 % | |
2 | 0 % | |
1 | 0 % |


