
Penerangan
⚠️ Kami telah berpindah ke 👉 PrimeQuant
🚫🚫🚫 Jangan beli penunjuk ini!
⚡ VERSI GENERASI SETERUSNYA TERSEDIA: Alat LudwigICT klasik ini telah direka semula, distruktur semula, dan dikeluarkan semula di bawah jenama pembangun baru kami, PrimeQuant. Versi baru ini menampilkan antara muka pengguna yang dipermudahkan dan sifat yang dikemas kini untuk keadaan pasaran semasa. Dapatkan versi yang dinaik taraf pada harga diskaun di sini:
👉 Penapis Trend ALMA-Gaussian
👉 Penapis Trend ALMA-Gaussian
👉 Penapis Trend ALMA-Gaussian
(Sila ambil perhatian: Senarai LudwigICT kekal aktif untuk pengguna warisan tetapi tidak akan menerima kemas kini atau diskaun harga aktif.)
Purata Pergerakan Gaussian ALMA Yang Diperhalusi (ASGMA) – oleh LudwigICT
Sebuah penunjuk mengikuti tren yang tepat yang menggabungkan pelicinan ALMA dengan Purata Pergerakan Gaussian adaptif untuk menapis bunyi dan mendedahkan bias pasaran yang sebenar.
🔹 Bagaimana ia berfungsi:
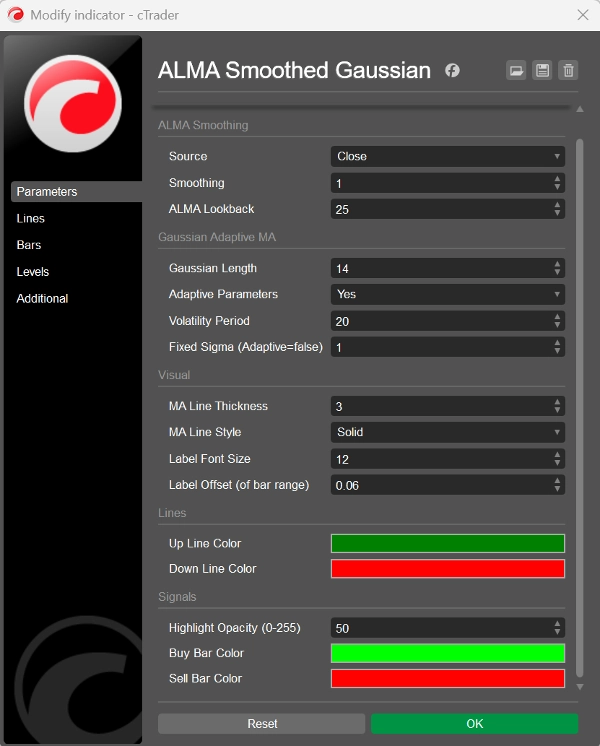
- Mengambil sumber harga pilihan anda (Tutup, Buka, Tinggi, Rendah, HL2, HLC3, OHLC4).
- Mengukur perubahan peratusan dan melicinkannya dengan ALMA (Arnaud Legoux MA).
- Menggunakan penapis Gaussian (adaptif kepada volatiliti, atau tetap) untuk garis tren yang diperhalusi.
- Mengesahkan arah dengan EMA tutup (7) untuk penjajaran yang responsif.
🔹 Apa yang anda lihat pada carta:
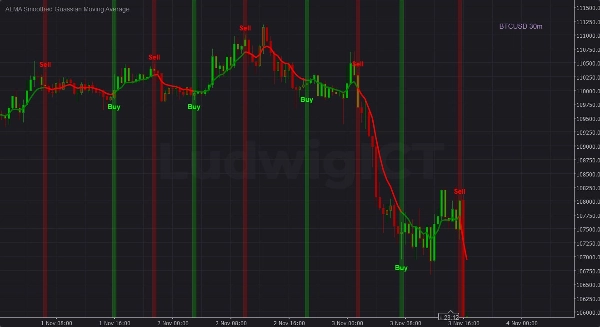
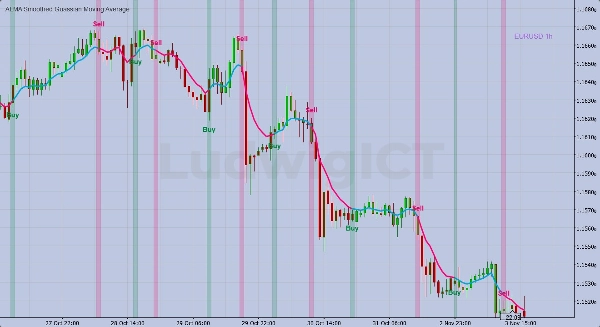
- Garis tren: Hijau = tren menaik, Merah = tren menurun.
- Lilinnya diwarnakan semula: Warna badan & sumbu yang selaras dengan tren untuk pengenalan bias segera.
- Isyarat Beli/Jual: Bar yang diserlahkan + label tebal apabila ALMA melintasi di atas/bawah MA Gaussian.
- Sorotan ketinggian penuh: Kekal kelihatan semasa menatal/memperbesar (tiada isyarat terlepas).
🔹 Apa yang diberikannya kepada pedagang:
✅ Sebuah peta tren yang bersih dan tanpa kelewatan
✅ Isyarat Beli/Jual yang pantas pada perubahan momentum
✅ Kurang kekacauan carta, lebih keyakinan dalam pelaksanaan
👉 Pendek kata: Ia adalah penunjuk tren tepat yang menapis bunyi, menyesuaikan diri dengan volatiliti, dan memberikan isyarat Beli/Jual yang jelas secara visual.
Jika anda mempunyai sebarang soalan atau menghadapi sebarang masalah, jangan ragu untuk menghubungi saya. Saya gembira untuk membantu anda!
Penafian:
Dengan menggunakan algoritma saya, anda mengakui bahawa perdagangan melibatkan risiko yang melekat dan prestasi lalu tidak menjamin hasil masa depan. Adalah penting bahawa anda mempunyai strategi pengurusan risiko yang kukuh dan, yang paling utama, anda kekal berdisiplin dalam mematuhi tahap stop-loss. Kegagalan mengurus risiko dengan betul boleh menyebabkan kerugian yang ketara. Saya tidak bertanggungjawab atas sebarang hasil kewangan yang timbul daripada penggunaan algoritma ini. Berdagang dengan bertanggungjawab dan sentiasa ikut amalan pengurusan risiko yang betul.
Semoga berjaya! 🙌
Ringkasan
Ulasan pelanggan
5 | 33 % | |
4 | 67 % | |
3 | 0 % | |
2 | 0 % | |
1 | 0 % |


