
説明
⚠️ 移転しました 👉 PrimeQuant
🚫🚫🚫 このインジケーターを購入しないでください!
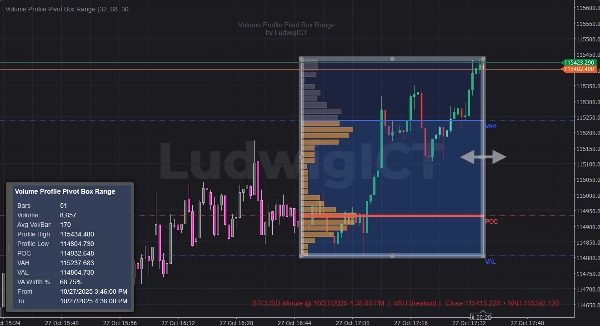
📊 LudwigICTによるボリュームプロファイルピボットボックスレンジインジケーター
真剣なプライスアクションおよびSMC/ICTトレーダー向けに構築されたスマートなピボットゾーン+ボリュームプロファイルシステムで、機関レベルの合流を解放します。
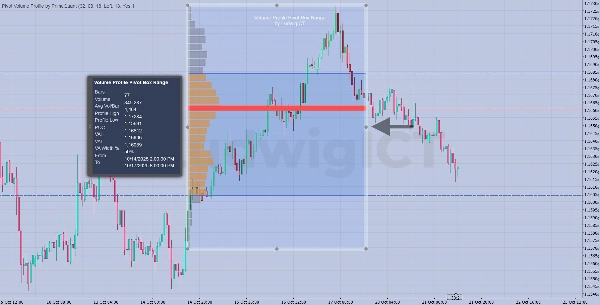
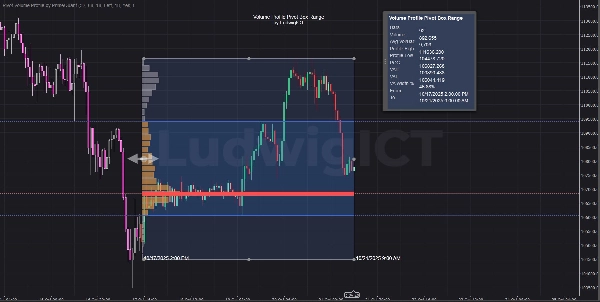
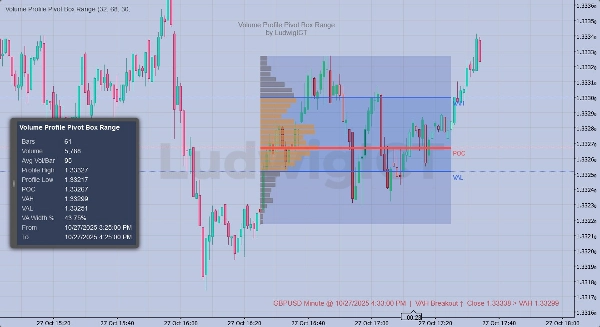
このインジケーターはスイングベースのレンジボックスを自動検出し、各ゾーン内のボリューム分布をマッピングし、真の機関ボリュームシフトを高度なボリューム加重キャンドルカラーリングで強調表示します。
数秒で蓄積、分配、流動性の獲得、ブレイクアウトトラップ、プレミアム・ディスカウントゾーンを特定します。
⭐ 主な特徴
- 🔍 自動ピボットレンジ/ボックス検出
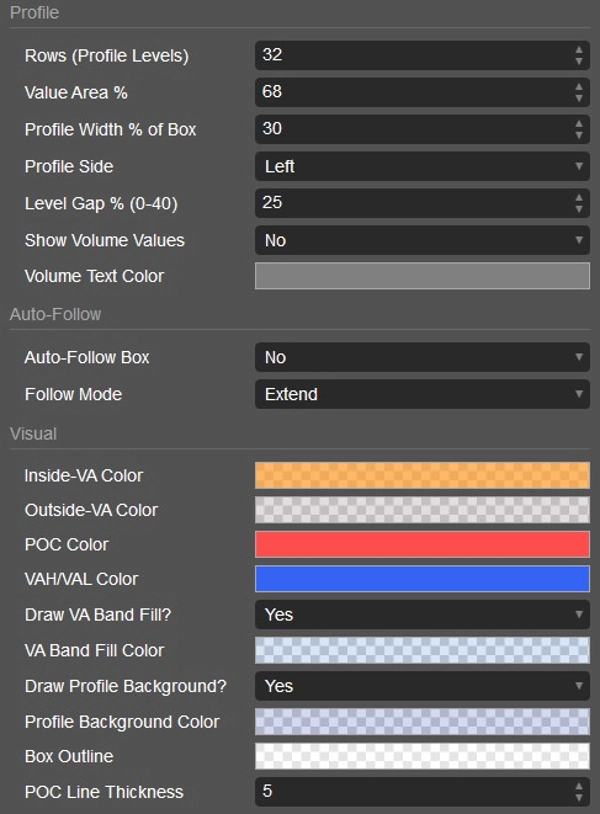
- 📈 ボックスごとの組み込みボリュームプロファイル
- 🧠 スマートマネーコンセプト / ICTスタイルのロジック
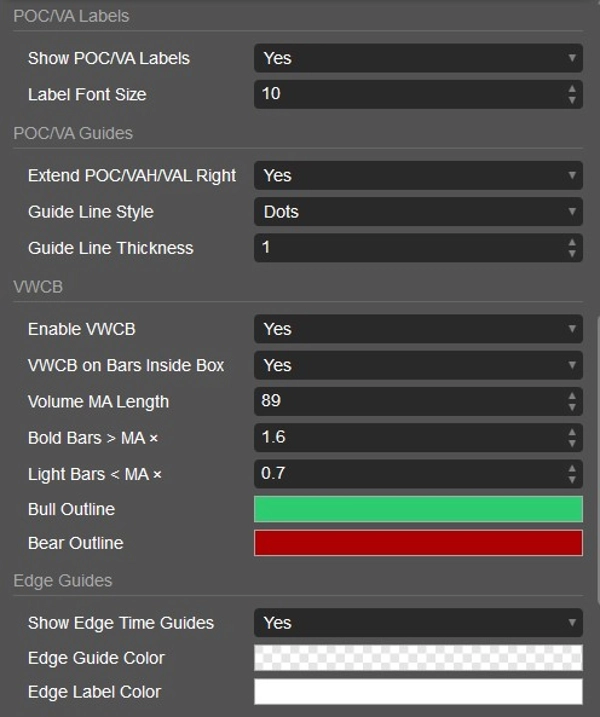
- 🎨 ボリューム加重キャンドルカラーリング(VWCB)
- ⚡ 実際のボリューム圧力&モメンタムシフトを検出
- 🚫 偽のブレイクアウト&流動性スイープを見分ける
- 🎯 スキャルピング&スイングトレードに最適
- 🌍 Forex、指数、ゴールド、暗号通貨で動作
- 🕒 マルチタイムフレーム対応
🧩 ボリューム加重キャンドルロジック
キャンドルは移動平均の閾値に対する実際のボリューム挙動に基づいて色付けされており、機関の参加が一目で見えるようになっています。
以下を確認してください:
✅ 強力な買い&売りのボリュームバースト
✅ 蓄積と分配の比較
✅ 疲弊の動き&反転
🎯 対象ユーザー
- SMC / ICTトレーダー
- オーダーフロー&ボリュームプロファイルトレーダー
- プライスアクションスキャルパー&スイングトレーダー
- プロップファーム&資金提供トレーダー
- cTraderアルゴ愛好家
⚙️ 最適な使用例
- 主要な流動性ゾーンを特定する
- 高ボリュームのブレイクアウトレベルを追跡する
- プレミアム/ディスカウントのエントリーを確認する
- 偽の急騰/スパイクをフィルターする
- レンジ相場&トレンド相場での精度を向上させる
✅ 推奨タイムフレーム
- M15 – H4 が最も明確
- すべての市場で動作
🛠 対応プラットフォーム
cTraderデスクトップ&cTrader自動化(cAlgo)
🎁 提供内容
- プレミアムカスタムcTraderインジケーター
- 無料アップデート
- サポート&セットアップガイダンス
🚀 より賢く取引しよう — マーケットメーカーの視点を見よう
チャートにボリュームに裏付けられた構造の明確さを加え、実行力をレベルアップしましょう。
ご質問や問題があれば、お気軽にご連絡ください。喜んでお手伝いします!
免責事項:
私のアルゴリズムを使用することで、取引には固有のリスクが伴い、過去のパフォーマンスが将来の結果を保証するものではないことを認識したものとします。堅実なリスク管理戦略を持ち、何よりもストップロスレベルを遵守する規律を保つことが不可欠です。リスク管理を適切に行わないと重大な損失を被る可能性があります。これらのアルゴリズムの使用による財務結果について私は責任を負いません。責任を持って取引し、常に適切なリスク管理を実践してください。
祝福を! 🙌
概要
カスタマーレビュー
5 | 33 % | |
4 | 67 % | |
3 | 0 % | |
2 | 0 % | |
1 | 0 % |


