
Description
Nous sommes passés à 👉 PrimeQuant
🚫🚫🚫 N'achetez pas cet indicateur !
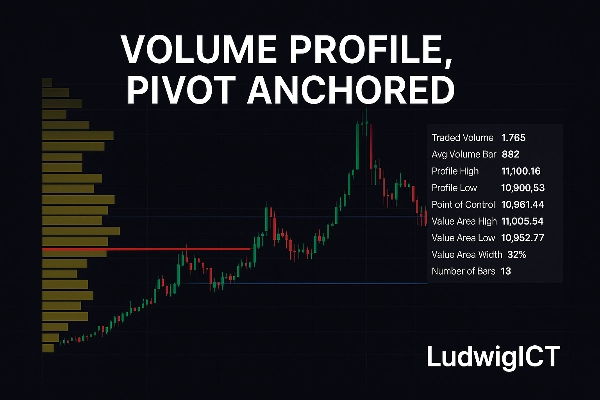
L'indicateur Volume Profile, Pivot Anchored apporte une approche professionnelle de la structure du marché et de l'analyse du volume directement dans cTrader. Conçu pour les traders qui valorisent la clarté, la précision et des informations exploitables, il révèle comment l'activité de trading est répartie sur le prix dans des plages de swing significatives.
⚡Offre exclusive – Limitée aux 10 premiers acheteurs !⚡
Débloquez tout le potentiel de votre stratégie de trading avec cet indicateur personnalisé puissant, conçu pour vous donner un avantage précis sur le marché. Cet outil a été conçu pour les traders sérieux qui souhaitent des signaux clairs et exploitables et une meilleure prise de décision lors du trading de XAU/USD et d'autres paires Forex.
🚀 Pourquoi l'obtenir maintenant :
Disponible à un prix spécial de lancement – uniquement pour les 10 premiers traders
Accédez à des informations avancées sur l'action des prix
Conçu pour une grande précision et fiabilité
Parfait pour le scalping et le swing trading
Une fois 10 copies vendues, cette offre ne sera plus disponible à ce prix. Sécurisez votre copie dès aujourd'hui et faites passer votre trading au niveau supérieur !
Que fait-il ?
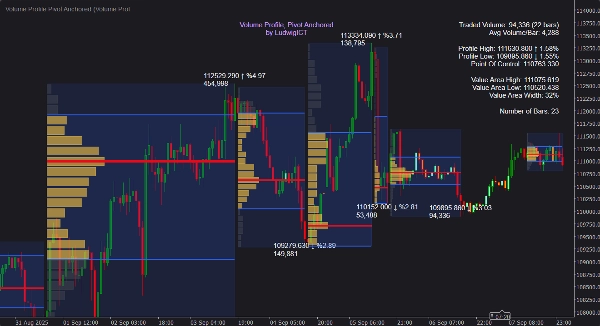
Contrairement aux profils fixes ou basés sur les sessions, cet outil ancre automatiquement les profils de volume aux pivots hauts et bas significatifs, cartographiant dynamiquement le processus d'enchères de chaque swing. Cela permet de voir où les participants au marché ont réellement engagé du capital — pas seulement où le prix s'est déplacé.
✨ Les éléments clés incluent :
📍 Détection automatique des pivots – Les profils sont construits entre les hauts et bas de swing, se mettant à jour à mesure que de nouveaux pivots se forment.
📊 Distribution détaillée du volume – Les histogrammes affichent comment le volume est réparti selon le prix, avec une résolution et une largeur définies par l'utilisateur.
🎯 Niveaux de zone de valeur & POC – Calcul instantané et visualisation du Point de Contrôle (POC), du Haut de la zone de valeur (VAH) et du Bas de la zone de valeur (VAL).
📈 Profil en développement – Un profil mis à jour en temps réel sur la jambe actuelle fournit un contexte prospectif.
➡️ Extension des zones POC – Projetez le POC vers l'avant jusqu'à ce qu'il soit touché ou franchi par le prix, mettant en évidence les zones de réaction futures.
📝 Étiquettes informatives & infobulles – Étiquettes de prix, % de changement, volume cumulatif, et un panneau statistique clair au survol.
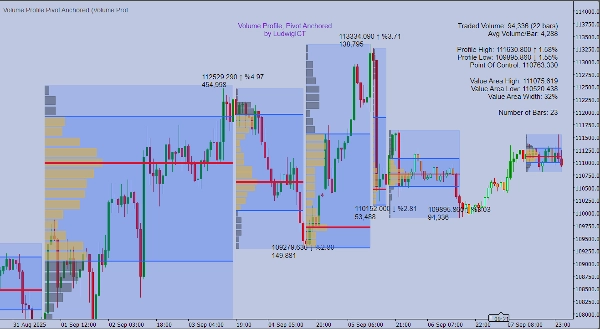
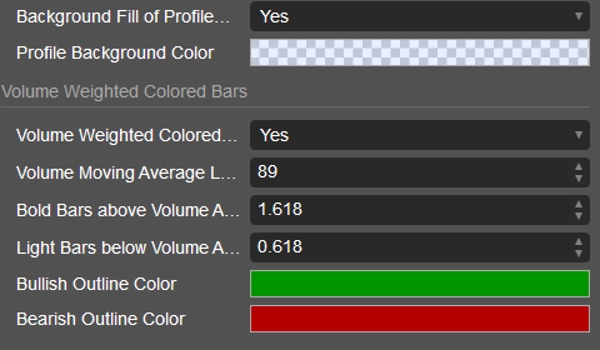
🎨 Coloration des barres pondérée par le volume – Les chandeliers sont ombrés selon l'intensité du volume pour une reconnaissance rapide des motifs.
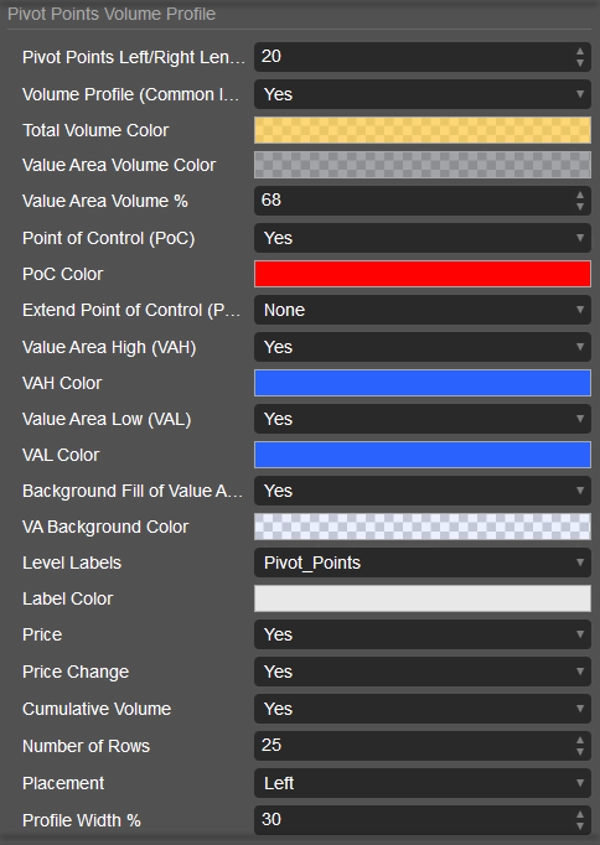
⚙️ Personnalisation complète – Ajustez les couleurs, le placement et l'affichage pour une intégration parfaite avec le style de votre graphique.
Comment l'utiliser
1️⃣ Attachez-le à n'importe quel graphique – fonctionne sur toutes les unités de temps et instruments.
2️⃣ Ajustez la longueur du pivot – contrôlez la sensibilité aux hauts/bas de swing (plus court = plus de profils, plus long = structure majeure uniquement).
3️⃣ Interprétez les profils dans leur contexte :
• 🎯 POC – niveau de prix avec le volume le plus échangé, souvent un aimant.
• 📏 VAH / VAL – limites de la zone de valeur, support/résistance puissant.
• 🌀 Forme de l'histogramme – identifiez les zones d'équilibre, de rejet et les changements de distribution.
4️⃣ Surveillez le profil en développement – suivez comment la structure d'enchères se construit en temps réel.
5️⃣ Utilisez les alertes – soyez notifié lorsque le prix interagit avec le POC, VAH, VAL, ou lorsque des barres à fort volume apparaissent.
6️⃣ Appliquez-le comme cadre – affinez les entrées aux niveaux basés sur le volume, anticipez les retournements et confirmez les tendances via la structure du volume.
Pourquoi les traders l'utilisent
Cet indicateur traduit le volume brut en une structure significative. En ancrant les profils aux pivots, il s'adapte à la dynamique du marché en direct au lieu de se baser sur des divisions arbitraires de session. Que ce soit pour le trading intraday, swing ou positionnel, la distribution du volume ancrée offre une clarté plus profonde pour la prise de décision.
Paramètres clés en un coup d'œil
⚙️ Sensibilité du pivot – définissez la détection des points de swing de manière plus ou moins agressive.
📊 Niveaux & largeur du profil – contrôlez la résolution et la visibilité du profil.
🎯 Modes d'extension du POC – Aucun, jusqu'à la dernière barre, jusqu'au toucher, ou jusqu'au croisement.
📏 Pourcentage de la zone de valeur – entièrement ajustable (par défaut 68%).
🎨 Coloration du volume – seuils pour mettre en évidence une participation forte/faible.
Volume Profile, Pivot Anchored par LudwigICT n'est pas une visualisation générique — c'est une lentille structurelle sur la manière dont les marchés réalisent réellement leurs enchères. Pour les traders qui exigent des outils professionnels, il offre un avantage décisif dans la lecture de l'interaction entre le prix et le volume.
Si vous avez des questions ou rencontrez des problèmes, n'hésitez pas à me contacter. Je suis heureux de vous aider !
Avertissement :
En utilisant mes algorithmes, vous reconnaissez que le trading comporte des risques inhérents et que les performances passées ne garantissent pas les résultats futurs. Il est essentiel d'avoir une stratégie de gestion des risques solide et, surtout, de rester discipliné en respectant les niveaux de stop-loss. Un mauvais contrôle des risques peut entraîner des pertes importantes. Je ne suis pas responsable des résultats financiers découlant de l'utilisation de ces algorithmes. Tradez de manière responsable et suivez toujours les bonnes pratiques de gestion des risques.
Bless up ! 🙌
Résumé
Avis clients
5 | 67 % | |
4 | 33 % | |
3 | 0 % | |
2 | 0 % | |
1 | 0 % |


