
Description
⚠️ Nous avons déménagé vers 👉 PrimeQuant
🚫🚫🚫 N'achetez pas cet indicateur !
⚡ VERSION DE NOUVELLE GÉNÉRATION DISPONIBLE : Cet outil classique LudwigICT a été repensé, restructuré et relancé sous notre nouvelle marque de développeur, PrimeQuant. La nouvelle version offre une interface utilisateur simplifiée et des propriétés mises à jour pour les conditions actuelles du marché. Obtenez la version améliorée à prix réduit ici :
👉 Suite complète ICT SMC - ADR AWR AMR OHLC Fibs EIS SR Alert
👉 Suite complète ICT SMC - ADR AWR AMR OHLC Fibs EIS SR Alert
👉 Suite complète ICT SMC - ADR AWR AMR OHLC Fibs EIS SR Alert
(Veuillez noter : la liste LudwigICT reste active pour les utilisateurs hérités mais ne recevra plus de mises à jour ni de réductions de prix actives.)
🔥 SUITE PRO ICT AVANCÉE + ADR + AWR
Arrêtez de deviner et commencez à voir le marché avec une clarté institutionnelle. La SUITE PRO ICT AVANCÉE de LudwigICT est un ensemble d'outils de cartographie professionnel tout-en-un conçu pour le trader exigeant en action de prix. Conçue méticuleusement pour être une réplication stable et visuellement parfaite de l'indicateur légendaire Pine Script, cette suite automatise la tâche complexe de cartographier les structures de marché critiques, vous libérant pour vous concentrer sur ce qui compte vraiment : votre stratégie et votre exécution.
Ce n'est pas simplement un autre indicateur ; c'est un cadre complet pour visualiser le marché. En intégrant parfaitement les concepts fondamentaux ICT de Prix, Temps, Volatilité et Momentum, cette suite offre une vue inégalée de qualité institutionnelle des marchés financiers, directement sur votre graphique cTrader.
Pourquoi choisir la suite LudwigICT ?
- Puissance tout-en-un : Cet indicateur unique remplace des dizaines d'outils séparés. Vous obtenez l'analyse Fibonacci, les projections de plage, la structure de marché multi-niveaux, le contexte des périodes supérieures et la coloration du momentum dans un seul package léger et efficace.
- Stabilité inébranlable est reine : Avez-vous déjà utilisé un indicateur où les niveaux sautent et se repeignent lorsque vous faites défiler ? Nous avons résolu ce problème. Notre logique propriétaire Ancrage Intelligent garantit que vos niveaux Fibonacci sont verrouillés sur des pivots historiques significatifs, fournissant un cadre cohérent et fiable qui ne s'adapte que lorsque la structure du marché change réellement.
- Perfection visuelle & clarté : Nous croyons que l'atout le plus précieux d'un trader est sa concentration. Cette suite est conçue pour améliorer la clarté, pas pour créer du désordre. Les éléments sont propres, non intrusifs et entièrement personnalisables. Les réglages par défaut sont prêts pour une utilisation professionnelle dès la sortie de la boîte.
- Conçu avec précision pour les traders sérieux : Chaque calcul, du système Elder Impulse à la plage moyenne quotidienne, a été rigoureusement testé pour correspondre 1:1 à la logique originale et fiable de Pine Script. Pas de raccourcis, pas d'approximations.
Fonctionnalités clés expliquées
La suite est composée de plusieurs modules puissants et indépendants que vous pouvez activer et personnaliser pour correspondre exactement à votre style de trading.
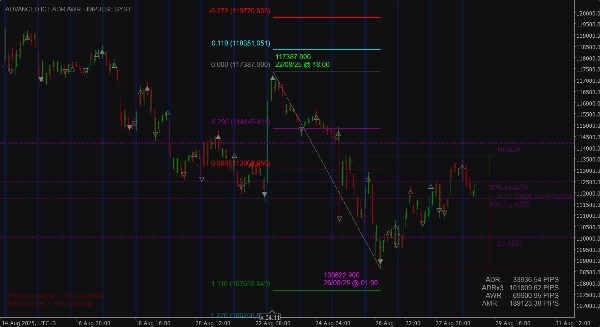
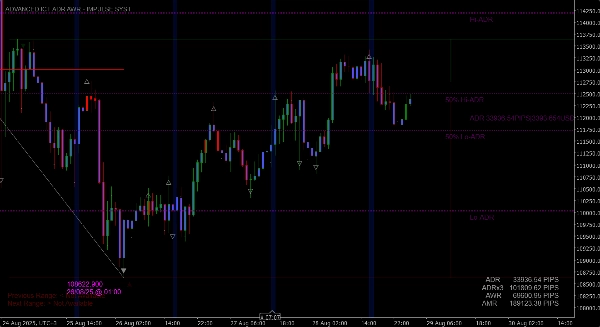
✔️ Retracement Fibonacci stable & ancré (Le cœur de la suite)
L'outil Fibonacci le plus stable et intelligent disponible sur cTrader.
- Logique d'ancrage intelligent : Identifie automatiquement et se verrouille sur le dernier swing haut et bas majeur et significatif, fournissant une plage de prix stable et fiable pour votre analyse.
- Réinitialisation intelligente de la cassure : Les niveaux Fibonacci restent ancrés jusqu'à ce que le prix réalise une clôture décisive au-delà de la plage établie (la distance de cassure est entièrement personnalisable). Cela empêche le tracé de sauter lors de retraits mineurs et garantit qu'il ne s'adapte que lorsque la structure du marché a réellement changé.
- La ligne de tendance en pointillés signature : La ligne diagonale en pointillés emblématique relie les points d'ancrage de votre plage Fibonacci, offrant une représentation visuelle claire de la tendance que vous analysez.
- Superposition ZigZag optionnelle : Pour une confirmation supplémentaire, vous pouvez activer une superposition ZigZag classique pour voir le chemin de tous les pivots historiques. Ceci est désactivé par défaut pour maintenir un graphique propre.
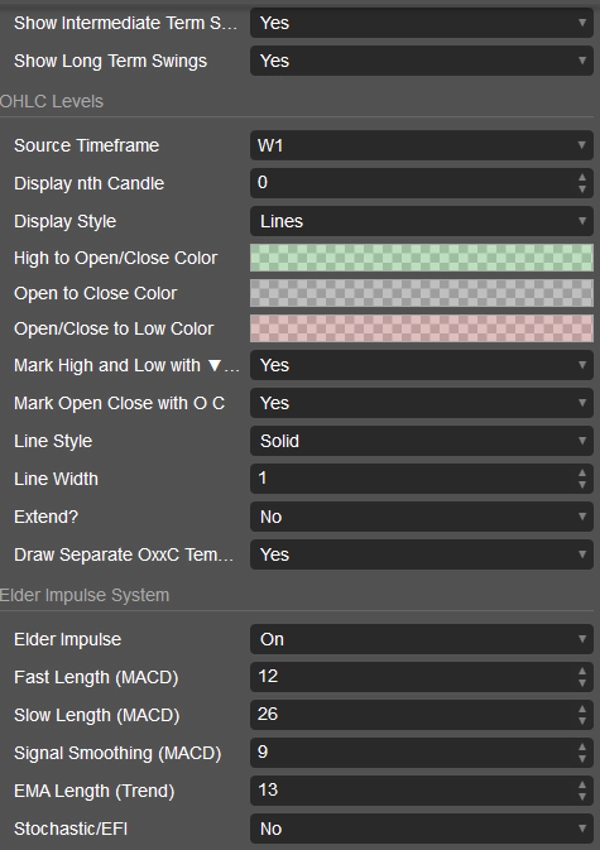
✔️ Système Elder Impulse (Coloration des barres de momentum)
Évaluez instantanément le triple consensus du marché : tendance, momentum et force.
- Barres vertes : Indiquent un consensus haussier (EMA 13 en hausse & histogramme MACD en hausse). Le marché est en forte tendance haussière.
- Barres rouges : Indiquent un consensus baissier (EMA 13 en baisse & histogramme MACD en baisse). Le marché est en forte tendance baissière.
- Barres bleues : Indiquent un état neutre ou un désaccord entre tendance et momentum. Moment de prudence.
- Bordures des barres : Une caractéristique subtile mais cruciale. Une bordure colorée est dessinée autour de chaque barre pour montrer sa véritable direction (clôture haussière ou baissière), ce qui est essentiel pour une analyse précise des chandeliers lorsque la couleur principale est remplacée.
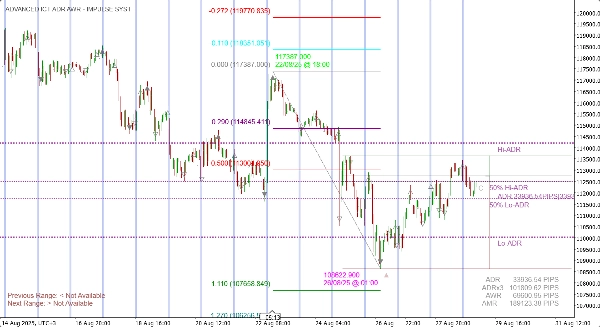
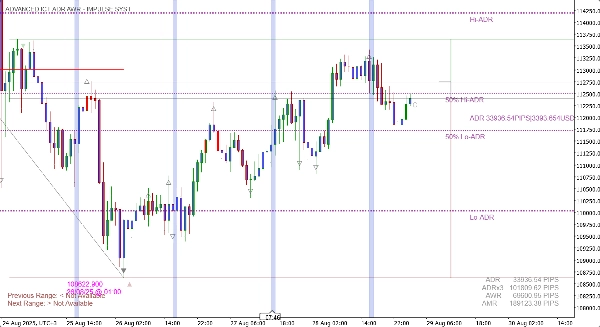
✔️ Projections avancées de plage (ADR, AWR, AMR)
Connaissez les limites de votre instrument et fixez des objectifs quotidiens, hebdomadaires et mensuels réalistes.
- Projections dynamiques : Calcule et trace automatiquement la plage moyenne quotidienne, hebdomadaire et mensuelle.
- Hauts et bas projetés : Voir les niveaux de support et de résistance projetés basés sur les plages calculées.
- Points médians à 50 % : Cruciaux pour identifier l'équilibre et les points potentiels de retournement dans la plage projetée.
- Tableau de données à l'écran : Un tableau propre et personnalisable affiche toutes les valeurs clés de la plage en pips et/ou en devise pour une référence rapide et facile.
✔️ Structure de marché multi-niveaux (Swings ST, IT, LT)
Arrêtez de dessiner manuellement les points de swing. L'indicateur le fait pour vous.
- Identification automatique : Trace les swings à court terme (ST), moyen terme (IT) et long terme (LT) directement sur votre graphique.
- Symboles clairs : Utilise un système simple et intuitif de points et triangles pour représenter la hiérarchie de la structure du marché.
✔️ Niveaux OHLC de périodes supérieures
Tradez avec un contexte multi-périodes sans jamais quitter votre graphique.
- Niveaux de prix clés : Superposez l'ouverture, le plus haut, le plus bas et la clôture de n'importe quelle période supérieure (ex. hebdomadaire, quotidienne) sous forme de lignes nettes ou de zones ombrées.
- Analyse des sessions : Voyez instantanément où se situe le prix actuel par rapport aux niveaux clés de la veille ou de la semaine précédente.
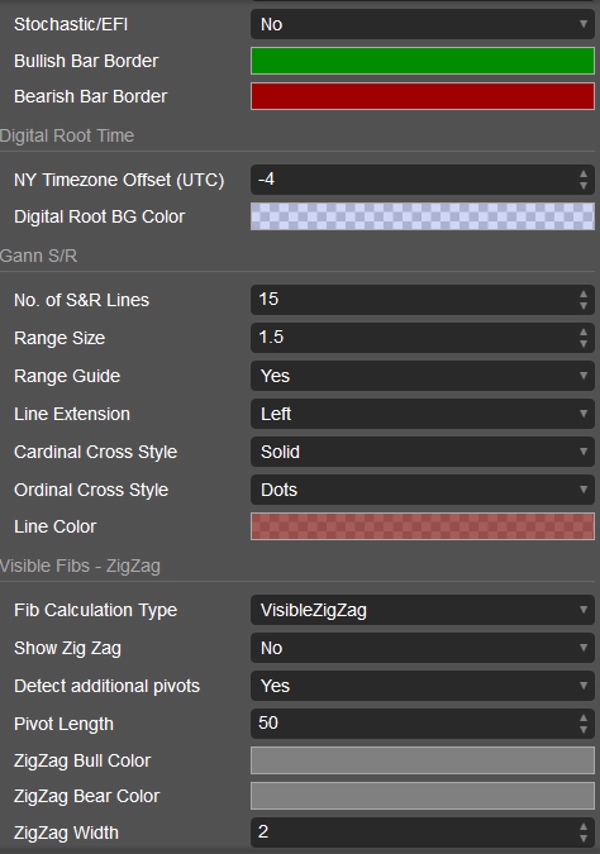
✔️ Outils dynamiques de support & résistance
- Niveaux Gann S/R : Un ensemble puissant de lignes de support et résistance dérivées mathématiquement qui s'adaptent à la volatilité de l'instrument.
- Temps racine numérique : Met en évidence des fenêtres temporelles spécifiques prédéfinies avec des barres verticales pleine hauteur qui redimensionnent dynamiquement lorsque vous déplacez et zoomez, assurant qu'elles sont toujours visibles.
Comment utiliser la SUITE PRO ICT AVANCÉE
Cette suite est un ensemble d'outils polyvalent, pas un simple indicateur de signal "achat/vente". Voici quelques façons de l'intégrer dans votre trading :
- Trading de confluence à haute probabilité :
-
- Attendez que le prix recule vers un niveau Fibonacci clé (par ex., le 0.618 ou le 0.786) dans une tendance stable et ancrée.
- Cherchez la confluence : ce niveau Fib correspond-il à un niveau OHLC de période supérieure ou à une ligne Gann S/R ?
- Utilisez le système Elder Impulse pour déclencher votre entrée. Attendez que la coloration des barres change en votre faveur (par ex., de bleu/rouge à vert pour une entrée longue) avant d'exécuter la transaction.
- Fixez vos objectifs de profit au prochain niveau d'extension Fib ou au haut/bas projeté ADR/AWR.
- Confirmation de tendance et entrées de momentum :
-
- Identifiez la tendance générale en utilisant les points de swing de la structure de marché (par ex., une série de plus hauts et plus bas plus élevés).
- Lors d'un recul, attendez que la couleur du Elder Impulse devienne bleue (neutre).
- Entrez en position dès que la couleur revient dans la direction de votre tendance (vert pour une tendance haussière, rouge pour une tendance baissière)
- Trading de retournement de plage et de session :
-
- Observez le prix approcher d'une limite clé, telle que le haut projeté ADR ou le plus haut du jour précédent.
- Cherchez des signes d'épuisement, comme un échec de clôture au-dessus du niveau et la couleur du Elder Impulse devenant bleue ou inversant vers la couleur opposée.
- Entrez un trade de retournement, en visant le niveau ADR à 50 % ou l'autre côté de la plage.
Liste complète des paramètres personnalisables
(Cette section donne aux clients confiance dans la flexibilité du produit)
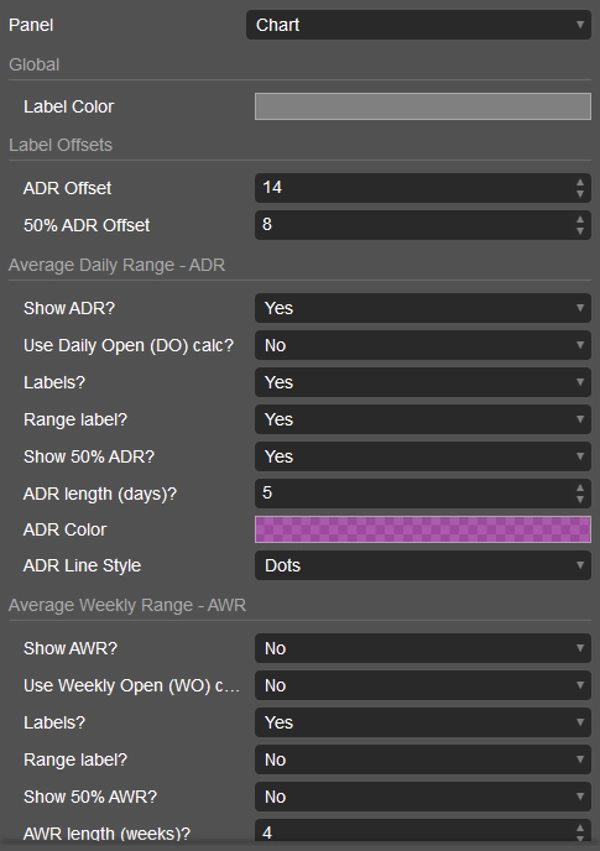
- Paramètres globaux : Couleurs des étiquettes, décalages.
- Plage moyenne quotidienne (ADR) : Activation/Désactivation, utilisation de l'ouverture quotidienne, affichage des étiquettes, affichage de la plage, affichage du niveau 50 %, période de retour, couleur, style de ligne.
- Plage moyenne hebdomadaire (AWR) : Paramètres entièrement personnalisables, identiques à ADR.
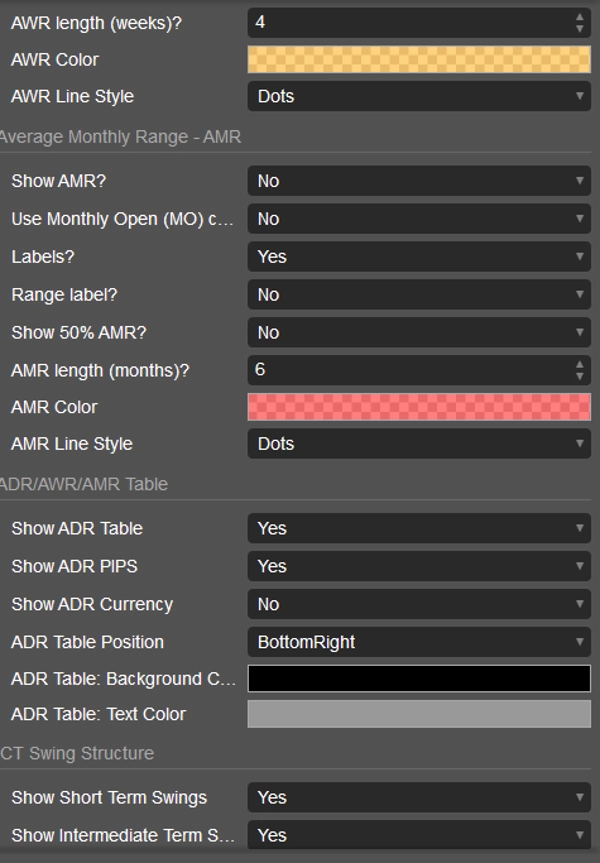
- Plage moyenne mensuelle (AMR) : Paramètres entièrement personnalisables, identiques à ADR.
- Tableau de données : Activation/Désactivation, affichage des pips, affichage de la devise, position à l'écran, couleurs.
- Structure de marché ICT : Activation indépendante des swings ST, IT et LT.
- Niveaux OHLC : Période source, retour sur chandelle, style d'affichage (lignes/boîtes), toutes les couleurs, marquer hauts/bas, marquer ouverture/fermeture, prolonger les lignes, afficher le modèle.
- Système Elder Impulse : Activation/Désactivation, tous les paramètres MACD et EMA, mode Stochastique/EFI, couleurs des bordures des barres haussières/baissières.
- Temps racine numérique : Décalage fuseau horaire NY, couleur de fond.
- Gann S/R : Nombre de lignes, taille de la plage, extension des lignes, styles de lignes, couleur.
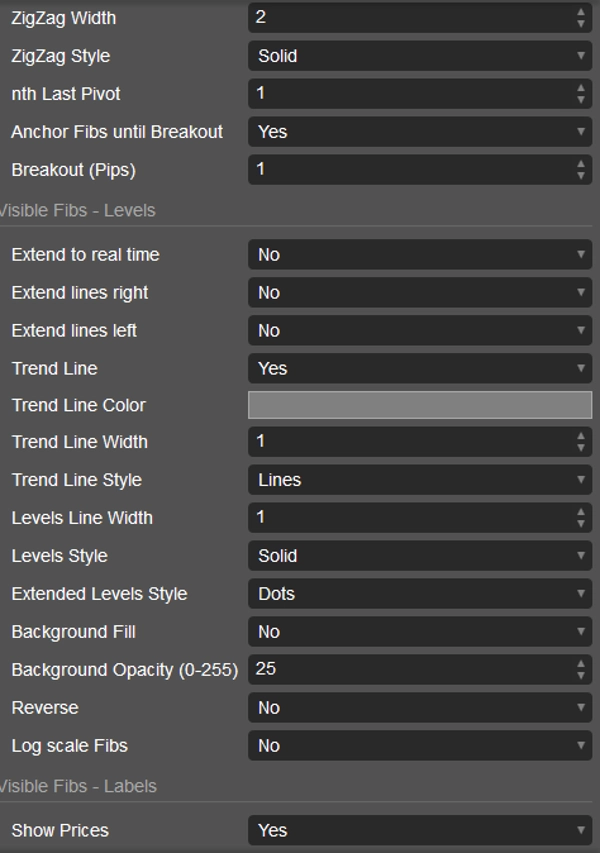
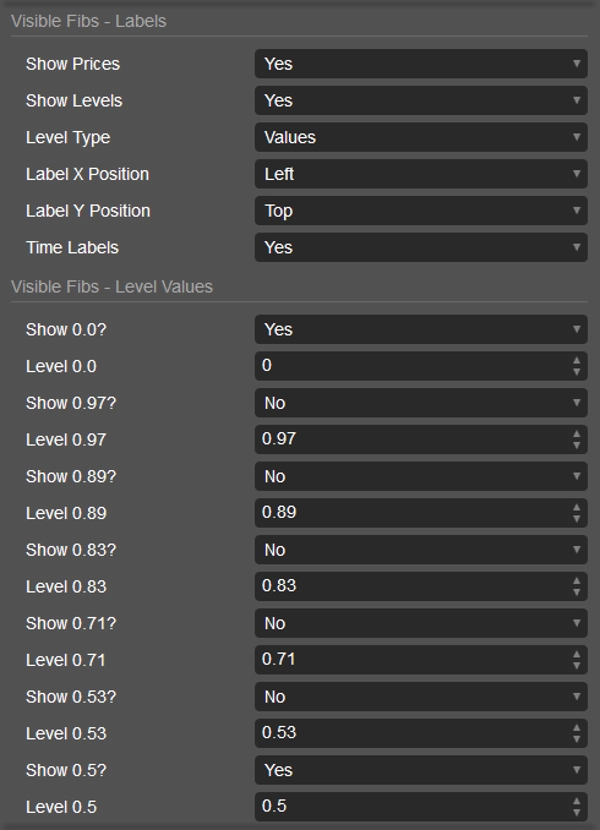
- Fibs visibles : Type de calcul (ZigZag/plage graphique), affichage ZigZag (désactivé par défaut), tous les paramètres ZigZag, ancrage stable & réinitialisation de cassure, tous les paramètres de niveau et de ligne, remplissage de fond, inversion, échelle logarithmique, contrôles d'étiquette, et plus de 25 niveaux Fibonacci individuels qui peuvent être activés, personnalisés et recolorés.
Élevez votre trading avec l'ultime boîte à outils d'action de prix. Arrêtez de tracer des lignes et commencez à voir les configurations. Obtenez la SUITE PRO ICT AVANCÉE de LudwigICT dès aujourd'hui ! 🚀🚀🚀
Si vous avez des questions ou rencontrez des problèmes, n'hésitez pas à me contacter. Je suis heureux de vous aider !
Avertissement :
En utilisant mes algorithmes, vous reconnaissez que le trading comporte des risques inhérents et que les performances passées ne garantissent pas les résultats futurs. Il est essentiel d'avoir une stratégie de gestion des risques solide en place et, surtout, de rester discipliné en respectant les niveaux de stop-loss. Un mauvais contrôle des risques peut entraîner des pertes importantes. Je ne suis pas responsable des résultats financiers découlant de l'utilisation de ces algorithmes. Tradez de manière responsable et suivez toujours les bonnes pratiques de gestion des risques.
Bien à vous ! 🙌
Résumé
Avis clients
5 | 50 % | |
4 | 50 % | |
3 | 0 % | |
2 | 0 % | |
1 | 0 % |


