
Deskripsi
⚠️ Kami pindah ke 👉 PrimeQuant
🚫🚫🚫 Jangan beli indikator ini!
⚡ VERSI GENERASI BERIKUTNYA TERSEDIA: Alat klasik LudwigICT ini telah didesain ulang, direstrukturisasi, dan dirilis kembali di bawah merek pengembang baru kami, PrimeQuant. Versi baru ini menampilkan antarmuka yang lebih sederhana dan properti yang diperbarui untuk kondisi pasar saat ini. Dapatkan versi yang ditingkatkan dengan harga diskon warisan di sini:
👉 Deteksi Otomatis Gelombang Elliott + Fibonacci
👉 Deteksi Otomatis Gelombang Elliott + Fibonacci
👉 Deteksi Otomatis Gelombang Elliott + Fibonacci
(Harap dicatat: Daftar LudwigICT tetap aktif untuk pengguna warisan tetapi tidak akan menerima pembaruan atau diskon harga aktif lagi.)
📈 Elliott Wave – Level Fibonacci [LudwigICT]
🔥 Buka kekuatan penuh Teori Gelombang Elliott yang dikombinasikan dengan retracement Fibonacci dinamis – semua otomatis untuk Anda di dalam cTrader!
Indikator ini menghadirkan penghitungan gelombang profesional dan zona Fibonacci yang tepat langsung ke grafik Anda, membuat peramalan tren dan eksekusi perdagangan menjadi lebih mudah dari sebelumnya.
✨ Fitur Utama
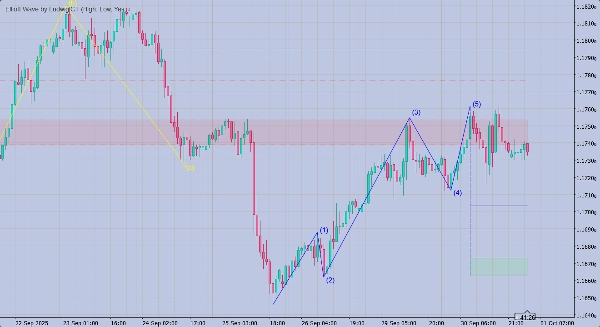
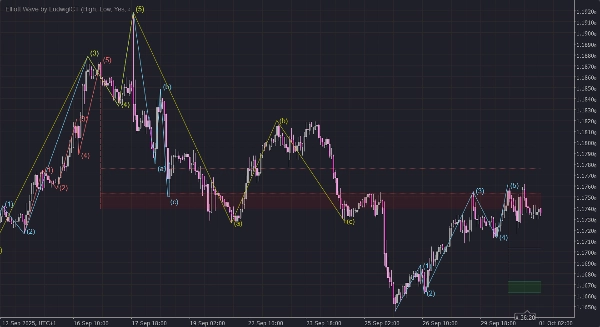
🔹 Deteksi Gelombang Otomatis
- Mengidentifikasi struktur motif 5 gelombang (1–5).
- Mendeteksi pola korektif 3 gelombang (A–B–C) segera setelah motif selesai.
🔹 Retracement Fibonacci Dinamis
- Secara otomatis memplot zona retracement utama: 0.500 • 0.618 • 0.764 • 0.854.
- Memperbarui secara real time dengan perkembangan gelombang.
- Menyoroti invalidasi dengan garis putus-putus.
🔹 Kerangka Multi-ZigZag
- Menjalankan tiga perhitungan ZigZag independen dengan panjang & warna yang dapat disesuaikan.
- Memastikan sensitivitas fleksibel untuk kondisi pasar yang berbeda.
🔹 Visual Profesional
- Label gelombang yang bersih
(1)…(5)dan(a)(b)(c)ditempatkan dengan offset pintar berbasis ATR. - Kotak breakout dengan penanda X tebal saat level dilanggar.
- Area isi Fibonacci seperti gradasi untuk memudahkan identifikasi.
🔹 Bantuan Perdagangan
- Identifikasi otomatis Gelombang Baru yang Mungkin (1) setelah koreksi A–B–C.
- Peringatan audio untuk gelombang baru, invalidasi, dan sinyal breakout.
🛠 Cara Menggunakan
- Terapkan ke Grafik
-
- Cukup seret & lepas Elliott Wave – Fibonacci Levels [LudwigICT] ke grafik cTrader Anda.
- Bekerja pada semua kerangka waktu (scalp, swing, jangka panjang).
- Sesuaikan Parameter
- Baca Gelombang
-
- ✅ Gelombang
(1–5)= Gelombang Motif (arah tren). - 🔄 Gelombang
(a–b–c)= Gelombang Korektif (lawan tren). - 📊 Level Fibonacci menunjukkan zona retracement yang mungkin untuk masuk/keluar.
- ✅ Gelombang
- Perdagangan dengan Percaya Diri
-
- Masuk perdagangan di sekitar retracement Fibonacci setelah gelombang motif selesai.
- Kelola risiko saat level dilanggar (indikator memberi peringatan otomatis).
- Cari ikon Gelombang Berikutnya (1) untuk mengantisipasi siklus tren baru.
🎯 Mengapa Memilih Indikator Ini?
✅ Menghemat jam penghitungan gelombang manual.
✅ Menghindari kesalahan subjektif dalam analisis Gelombang Elliott.
✅ Visual yang bersih, tepat, dan profesional langsung di grafik Anda.
✅ Dibuat & dioptimalkan oleh LudwigICT, terpercaya dalam otomasi perdagangan.
🖥 Kompatibilitas
- Platform: cTrader Desktop v5+
- Instrumen: Bekerja pada Forex, Saham, Indeks, Komoditas, Kripto.
- Kerangka waktu: Dari scalping 1m hingga analisis swing mingguan.
⚡️ Mulai Sekarang
🚀 Tambahkan Elliott Wave – Fibonacci Levels [LudwigICT] ke arsenal perdagangan Anda hari ini dan tingkatkan analisis grafik Anda ke level berikutnya!
👉 Sempurna untuk trader yang mengandalkan aksi harga, struktur, dan retracement Fibonacci untuk mengatur waktu masuk dan keluar dengan presisi.
Jika Anda memiliki pertanyaan atau mengalami masalah, jangan ragu untuk menghubungi saya. Saya senang membantu Anda!
Penafian:
Dengan menggunakan algoritma saya, Anda mengakui bahwa perdagangan melibatkan risiko inheren dan bahwa kinerja masa lalu tidak menjamin hasil di masa depan. Sangat penting untuk memiliki strategi manajemen risiko yang solid dan, di atas semua itu, tetap disiplin dalam mematuhi level stop-loss. Kegagalan dalam mengelola risiko dengan benar dapat menyebabkan kerugian signifikan. Saya tidak bertanggung jawab atas hasil keuangan yang timbul dari penggunaan algoritma ini. Berdaganglah dengan bertanggung jawab dan selalu ikuti praktik manajemen risiko yang tepat.
Semoga sukses! 🙌
Ringkasan
Ulasan pelanggan
5 | 100 % | |
4 | 0 % | |
3 | 0 % | |
2 | 0 % | |
1 | 0 % |


