
Description
⚠️ Nous avons déménagé vers 👉 PrimeQuant
🚫🚫🚫 N'achetez pas cet indicateur !
🎯 Aperçu
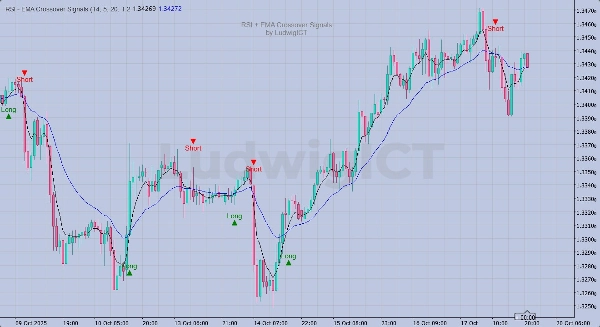
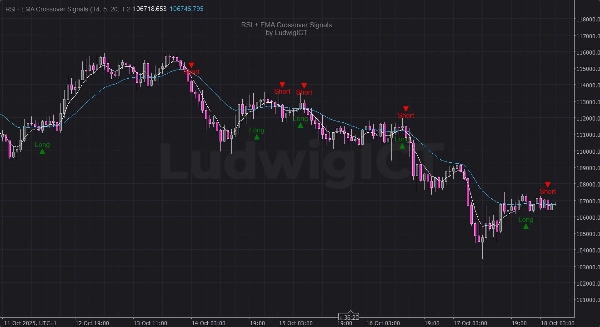
L'indicateur RSI + EMA Crossover Signals de LudwigICT combine la dynamique et la confirmation de tendance pour générer des signaux de trading Long/Short à haute confiance — directement sur votre graphique.
⚙️ Comment ça fonctionne :
- Étape du signal RSI :
-
- Un signal est armé lorsque le RSI croise sa propre ligne de signal SMA.
- Étape de confirmation EMA :
-
- Le signal est déclenché uniquement lorsque les EMA rapides et lentes se croisent dans la même direction.
- Annulation du signal :
-
- Tout croisement opposé (RSI ou EMA) annule un signal non déclenché.
✨ Caractéristiques clés :
- 🔁 Logique de double confirmation (RSI + EMA)
- 📈 Icônes claires Long et Short tracées directement sur le graphique
- ⚡ Décalages visuels dynamiques basés sur l'ATR (s'ajuste automatiquement à la volatilité)
- 💧 Superposition propre avec un filigrane permanent
- 🧠 Logique intelligente d’“armement” et d’“annulation” pour réduire les déclenchements erronés
- 🧮 Paramètres RSI, EMA et décalage entièrement ajustables
🔧 Entrées :
- Période RSI (par défaut : 14)
- EMA rapide (par défaut : 5)
- EMA lente (par défaut : 20)
- Décalage du signal (multiplicateur ATR, par défaut : 1,2)
📊 Idéal pour :
- Les traders de momentum
- Les systèmes de confirmation de tendance
- Les stratégies de trading manuelles ou semi-automatisées
📅 Mises à jour de la version :
- ✅ Ajout d'un décalage dynamique basé sur l'ATR pour une meilleure visibilité
- ✅ Amélioration de la logique de précision des signaux
- ✅ Ajout d'un filigrane non amovible pour l'authenticité
© 2025 LudwigICT — Tous droits réservés.
Si vous avez des questions ou rencontrez des problèmes, n'hésitez pas à me contacter. Je suis heureux de vous aider !
Avertissement :
En utilisant mes algorithmes, vous reconnaissez que le trading comporte des risques inhérents et que les performances passées ne garantissent pas les résultats futurs. Il est essentiel d'avoir une stratégie de gestion des risques solide et, surtout, de rester discipliné en respectant les niveaux de stop-loss. Le non-respect d'une gestion appropriée des risques peut entraîner des pertes importantes. Je ne suis pas responsable des résultats financiers découlant de l'utilisation de ces algorithmes. Tradez de manière responsable et suivez toujours les bonnes pratiques de gestion des risques.
Bénédictions ! 🙌
Résumé
Avis clients
5 | 0 % | |
4 | 100 % | |
3 | 0 % | |
2 | 0 % | |
1 | 0 % |


