
Opis
⚠️ Przenieśliśmy się do 👉 PrimeQuant
🚫🚫🚫 Nie kupuj tego wskaźnika!
ICT CONCEPTS autorstwa LudwigICT (odpowiednik cTrader popularnych ICT Concepts z TradingView)
Doświadcz precyzji instytucjonalnej z ICT Concepts — kompletnym zestawem narzędzi Smart Money stworzonym, aby wizualizować rynek tak, jak widzą go profesjonaliści.
🔹 Funkcje
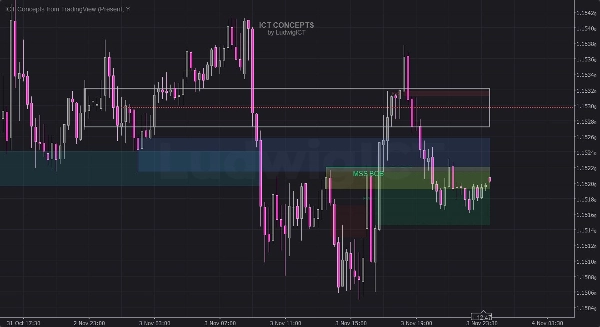
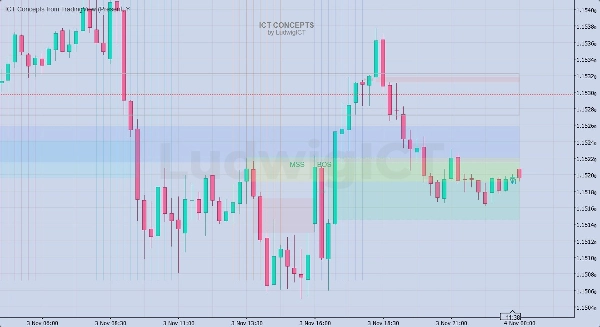
- 📈 Wykrywanie struktury rynku — automatyczne podświetlanie BOS (Break of Structure) i MSS (Market Structure Shift), które dostosowują się do ruchu cen w czasie rzeczywistym.
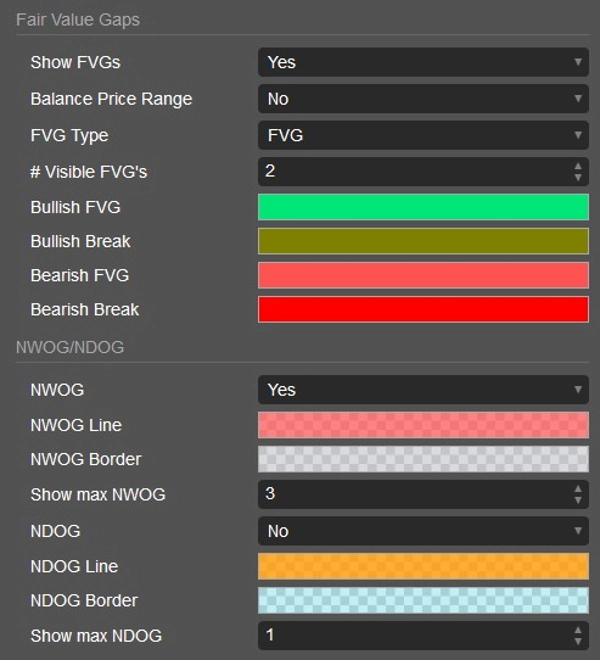
- 🟩 Luki wartości godziwej (FVG) i zakresy cen równowagi (BPR) — natychmiastowe wykrywanie stref premii i dyskonta, tak jak w profesjonalnych modelach ICT.
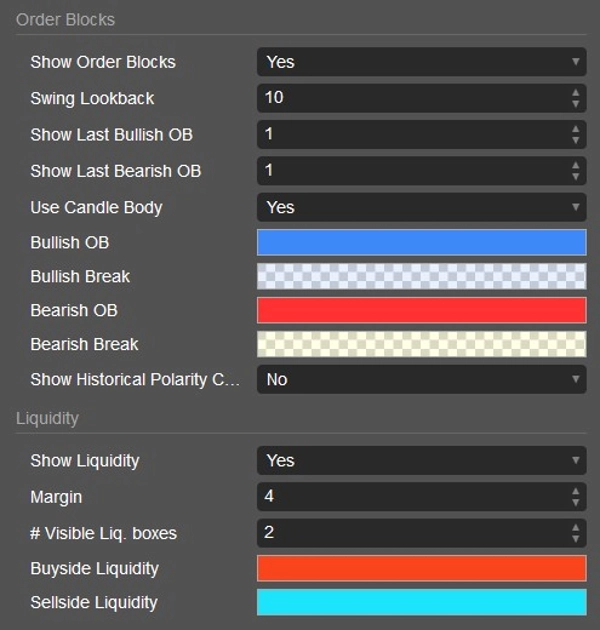
- 💧 Strefy płynności — automatycznie oznacza pule płynności po stronie kupujących i sprzedających, gdzie cena prawdopodobnie będzie szukać lub reagować.
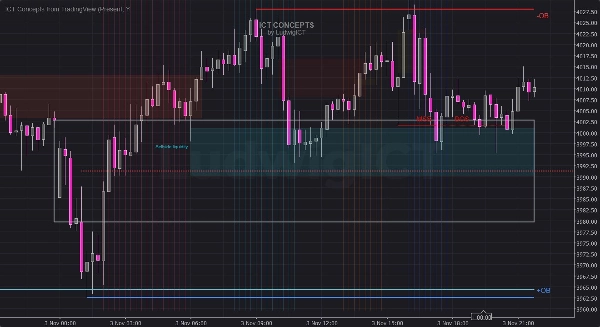
- 🧱 Bloki zleceń (OB) — identyfikuje bycze i niedźwiedzie bloki zleceń oraz śledzi, czy utrzymują się, czy zostają przełamane.
- ⚡ Nierównowaga wolumenu i świece przesunięcia — pokazują siłę instytucjonalną i nieskuteczność między kupującymi a sprzedającymi.
- 🌅 Luki NWOG / NDOG — wyświetla tygodniowe i dzienne luki otwarcia, aby podkreślić brakujące obszary cenowe.
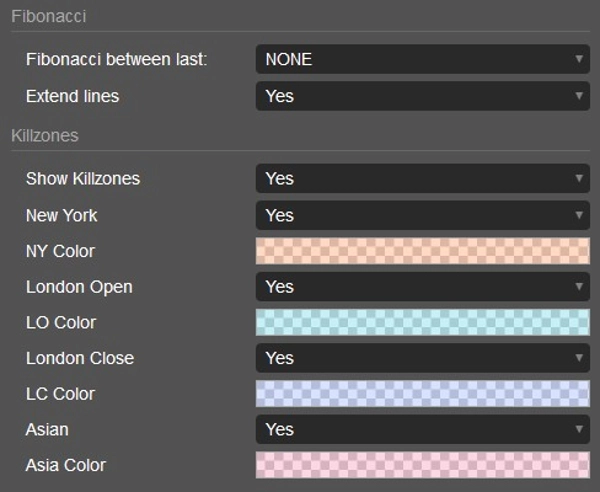
- 🕓 Nakładka Killzones — pokazuje sesje londyńską, nowojorską i azjatycką dla konfluencji opartej na czasie.
- 🔢 Zintegrowane cele Fibonacciego — automatycznie rysuje cofnięcia i projekcje zgodne z wybraną strukturą.
🧭 Jak używać
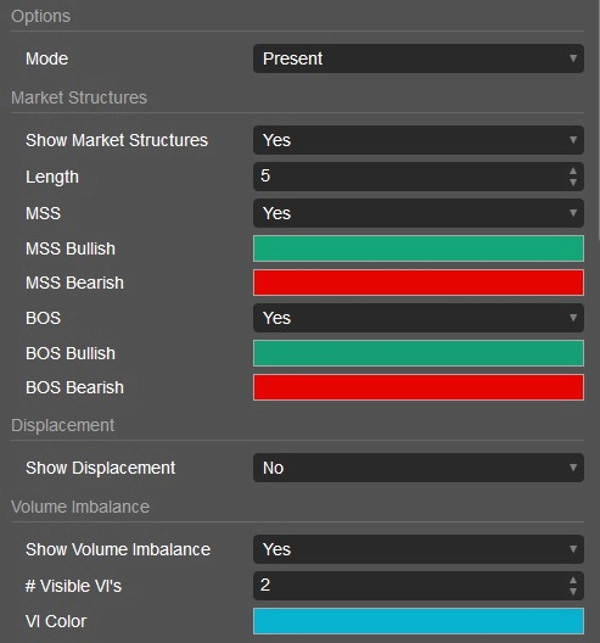
- Dołącz wskaźnik do dowolnego wykresu i pozostaw ustawienia domyślne, aby zacząć — automatycznie dostosowuje się do Twojego symbolu i interwału czasowego.
- Łącz różne koncepcje: na przykład szukaj BOS + FVG + OB dla ustawień o wysokim prawdopodobieństwie.
- Używaj go do analizy zachowania cen wokół pul płynności, świec przesunięcia i tygodniowych luk.
- Dla traderów intraday włącz Killzones, aby skupić się na najbardziej aktywnych sesjach.
- Dostosuj limity widoczności (np. „Widoczne FVG” lub „Max NWOG”), aby dopasować klarowność wykresu do swoich preferencji.
To narzędzie działa bezproblemowo na rynku Forex, indeksach, towarach, kryptowalutach i akcjach — idealne zarówno do analizy, jak i realizacji transakcji.
⚙️ Dlaczego wyniki mogą się nieznacznie różnić między brokerami lub TradingView
cTrader używa czasu serwera, feedu symbolu i agregacji danych Twojego brokera, podczas gdy TradingView często korzysta z kompozytowych lub syntetycznych feedów.
Niewielkie różnice w zamknięciach świec, obsłudze danych weekendowych lub cenach ułamkowych mogą nieznacznie przesunąć pozycję struktur (takich jak BOS czy OB).
To normalne na różnych platformach handlowych i nie wpływa na podstawową logikę ani wiarygodność koncepcji.
⚠️ Zastrzeżenie
Ten wskaźnik to profesjonalne narzędzie analityczne — nie porada finansowa.
Zawsze wykonuj własną analizę i zarządzaj ryzykiem odpowiedzialnie przed zawarciem jakichkolwiek transakcji
Podsumowanie
Opinie klientów
5 | 50 % | |
4 | 50 % | |
3 | 0 % | |
2 | 0 % | |
1 | 0 % |


