
Descripción
⚠️ Nos mudamos a 👉 PrimeQuant
🚫🚫🚫 ¡No compres este indicador!
⚡ VERSIÓN DE PRÓXIMA GENERACIÓN DISPONIBLE: Esta herramienta clásica de LudwigICT ha sido rediseñada, reestructurada y relanzada bajo nuestra nueva marca de desarrollador, PrimeQuant. La nueva versión presenta una interfaz optimizada y propiedades actualizadas para las condiciones actuales del mercado. Obtén la versión mejorada a un precio con descuento aquí:
👉 Complete ICT SMC Suite - ADR AWR AMR OHLC Fibs EIS SR Alert
👉 Complete ICT SMC Suite - ADR AWR AMR OHLC Fibs EIS SR Alert
👉 Complete ICT SMC Suite - ADR AWR AMR OHLC Fibs EIS SR Alert
(Por favor, ten en cuenta: la lista de LudwigICT sigue activa para usuarios heredados pero ya no recibirá actualizaciones ni descuentos activos.)
🔥 ADVANCED ICT + ADR + AWR SUITE PRO
Deja de adivinar y comienza a ver el mercado con claridad institucional. La ADVANCED ICT SUITE PRO de LudwigICT es un conjunto profesional todo en uno diseñado para el trader exigente de acción del precio. Meticulosamente diseñada para ser una replicación estable y visualmente perfecta del legendario indicador Pine Script, esta suite automatiza la compleja tarea de graficar estructuras críticas del mercado, liberándote para enfocarte en lo que realmente importa: tu estrategia y ejecución.
Esto no es solo otro indicador; es un marco completo para visualizar el mercado. Al integrar perfectamente los conceptos centrales de ICT de Precio, Tiempo, Volatilidad y Momentum, esta suite ofrece una vista institucional sin igual de los mercados financieros, directamente en tu gráfico de cTrader.
¿Por qué elegir la Suite LudwigICT?
- Potencia Todo en Uno: Este único indicador reemplaza docenas de herramientas separadas. Obtienes análisis de Fibonacci, proyecciones de rango, estructura de mercado multinivel, contexto de marcos temporales superiores y coloreado de momentum en un paquete ligero y eficiente.
- Estabilidad Inquebrantable es Rey: ¿Alguna vez usaste un indicador donde los niveles saltan y se repintan al desplazarte? Nosotros hemos solucionado eso. Nuestra lógica propietaria de Anclaje Inteligente asegura que tus niveles de Fibonacci estén bloqueados a pivotes históricos significativos, proporcionando un marco consistente y confiable que solo se adapta cuando la estructura del mercado realmente cambia.
- Perfección Visual y Claridad: Creemos que el activo más valioso de un trader es su concentración. Esta suite está diseñada para mejorar la claridad, no para crear desorden. Los elementos son limpios, no intrusivos y totalmente personalizables. La configuración predeterminada está lista para uso profesional desde el primer momento.
- Diseñado con Precisión para Traders Serios: Cada cálculo, desde el Elder Impulse System hasta el Average Daily Range, ha sido rigurosamente probado para ser una coincidencia 1:1 con la lógica original y confiable de Pine Script. Sin atajos, sin aproximaciones.
Características Clave Explicadas
La suite está compuesta por varios módulos potentes e independientes que puedes activar y personalizar para adaptarlos a tu estilo de trading exacto.
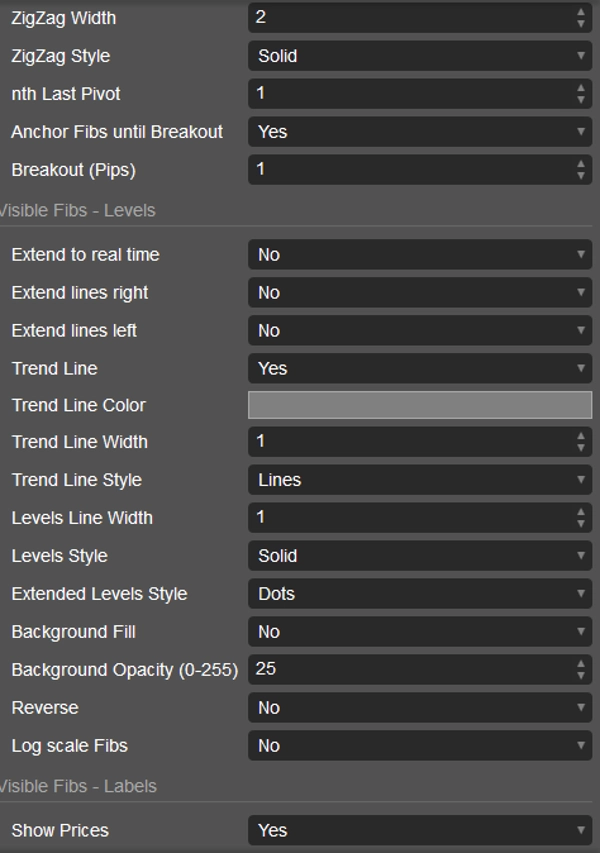
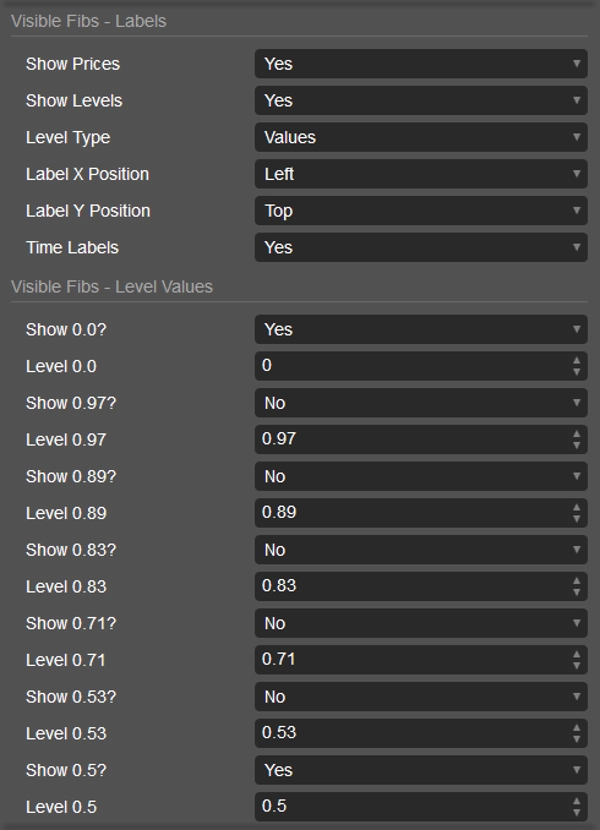
✔️ Retroceso de Fibonacci Estable y Anclado (El Corazón de la Suite)
La herramienta de Fibonacci más estable e inteligente disponible en cTrader.
- Lógica de Anclaje Inteligente: Identifica automáticamente y se ancla al último swing alto y bajo mayor y significativo, proporcionando un rango de precios estable y confiable para tu análisis.
- Reinicio Inteligente de Ruptura: Los niveles de Fibonacci permanecen anclados hasta que el precio cierre de manera decisiva fuera del rango establecido (la distancia de ruptura es totalmente personalizable). Esto evita que el dibujo salte en retrocesos menores y asegura que solo se adapte cuando la estructura del mercado realmente ha cambiado.
- La Línea de Tendencia Discontinua Icónica: La línea diagonal discontinua icónica conecta los puntos de anclaje de tu rango de Fibonacci, proporcionando una representación visual clara de la tendencia que estás analizando.
- Superposición Opcional ZigZag: Para confirmación adicional, puedes activar una superposición clásica ZigZag para ver el camino de todos los pivotes históricos. Esto está desactivado por defecto para mantener un gráfico limpio.
✔️ Elder Impulse System (Coloreado de Barras de Momentum)
Evalúa instantáneamente el triple consenso del mercado: tendencia, momentum y fuerza.
- Barras Verdes: Indican consenso alcista (EMA 13 en ascenso y Histograma MACD en ascenso). El mercado está en una fuerte tendencia alcista.
- Barras Rojas: Indican consenso bajista (EMA 13 en descenso y Histograma MACD en descenso). El mercado está en una fuerte tendencia bajista.
- Barras Azules: Indican un estado neutral o desacuerdo entre tendencia y momentum. Momento para precaución.
- Bordes de las Barras: Una característica sutil pero crítica. Se dibuja un borde coloreado alrededor de cada barra para mostrar su verdadera dirección (cierre alcista o bajista), lo cual es esencial para un análisis preciso de velas cuando el color principal es sobrescrito.
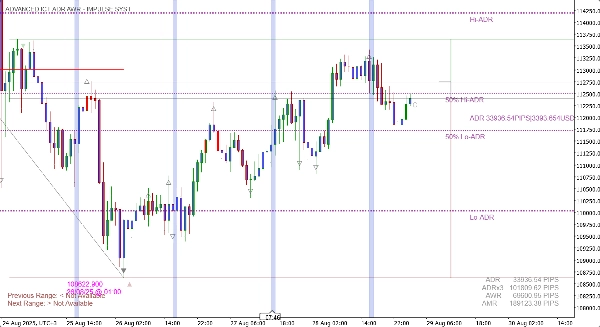
✔️ Proyecciones Avanzadas de Rango (ADR, AWR, AMR)
Conoce los límites de tu instrumento y establece objetivos diarios, semanales y mensuales realistas.
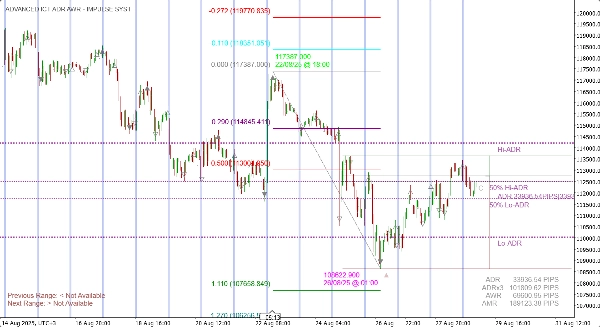
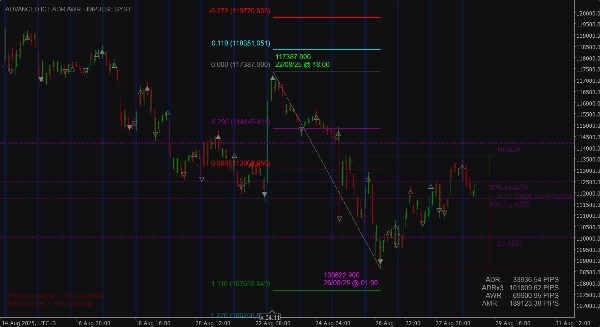
- Proyecciones Dinámicas: Calcula y grafica automáticamente el Rango Diario Promedio, Rango Semanal Promedio y Rango Mensual Promedio.
- Altos y Bajos Proyectados: Ve niveles proyectados de soporte y resistencia basados en los rangos calculados.
- Puntos Medios al 50%: Cruciales para identificar equilibrio y posibles puntos de reversión dentro del rango proyectado.
- Tabla de Datos en Pantalla: Una tabla limpia y personalizable muestra todos los valores clave del rango en Pips y/o moneda para referencia rápida y visual.
✔️ Estructura de Mercado Multinivel (Swings ST, IT, LT)
Deja de dibujar puntos de swing manualmente. El indicador lo hace por ti.
- Identificación Automática: Grafica swings de Corto Plazo (ST), Mediano Plazo (IT) y Largo Plazo (LT) directamente en tu gráfico.
- Símbolos Claros: Usa un sistema simple e intuitivo de puntos y triángulos para representar la jerarquía de la estructura del mercado.
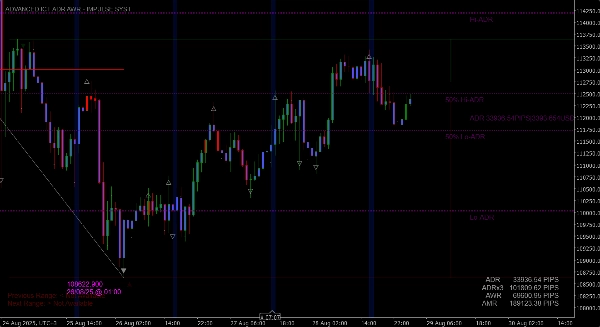
✔️ Niveles OHLC de Marcos Temporales Superiores
Opera con contexto de múltiples marcos temporales sin salir de tu gráfico.
- Niveles Clave de Precio: Superpone la Apertura, Máximo, Mínimo y Cierre de cualquier marco temporal superior (por ejemplo, Semanal, Diario) como líneas limpias o cajas sombreadas.
- Análisis de Sesión: Ve instantáneamente dónde está el precio actual en relación con los niveles clave del día o semana anterior.
✔️ Herramientas Dinámicas de Soporte y Resistencia
- Niveles Gann S/R: Un conjunto poderoso de líneas de soporte y resistencia derivadas matemáticamente que se adaptan a la volatilidad del instrumento.
- Tiempo de Raíz Digital: Resalta ventanas de tiempo específicas predefinidas con barras verticales de altura completa que se redimensionan dinámicamente al desplazar y hacer zoom, asegurando que siempre sean visibles.
Cómo Usar la ADVANCED ICT SUITE PRO
Esta suite es un conjunto de herramientas versátil, no un simple indicador de señal "compra/venta". Aquí hay algunas formas de integrarla en tu trading:
- Trading de Confluencia de Alta Probabilidad:
-
- Espera a que el precio retroceda a un nivel clave de Fibonacci (por ejemplo, el 0.618 o 0.786) dentro de una tendencia estable y anclada.
- Busca confluencia: ¿Este nivel Fib coincide con un Nivel OHLC de Marco Temporal Superior o una Línea Gann S/R?
- Usa el Elder Impulse System para tu disparador de entrada. Espera a que el color de la barra cambie a tu favor (por ejemplo, de azul/rojo a verde para una entrada larga) antes de ejecutar la operación.
- Establece tus objetivos de ganancia en el siguiente nivel de extensión Fib o en el proyectado ADR/AWR Alto/Bajo.
- Confirmación de Tendencia y Entradas por Momentum:
-
- Identifica la tendencia general usando los puntos de swing de la Estructura de Mercado (por ejemplo, una serie de máximos y mínimos más altos).
- Durante un retroceso, espera a que el color del Elder Impulse se torne azul (neutral).
- Entra en la operación tan pronto como el color cambie de nuevo a la dirección de tu tendencia (verde para una tendencia alcista, rojo para una bajista)
- Trading de Reversión de Rango y Sesión:
-
- Observa el precio acercándose a un límite clave, como el proyectado ADR Alto o el Máximo del Día Anterior.
- Busca señales de agotamiento, como que el precio no cierre por encima del nivel y el color del Elder Impulse se torne azul o cambie al color opuesto.
- Entra en una operación de reversión, apuntando al nivel 50% del ADR o al otro lado del rango.
Lista Completa de Parámetros Personalizables
(Esta sección brinda a los clientes confianza en la flexibilidad del producto)
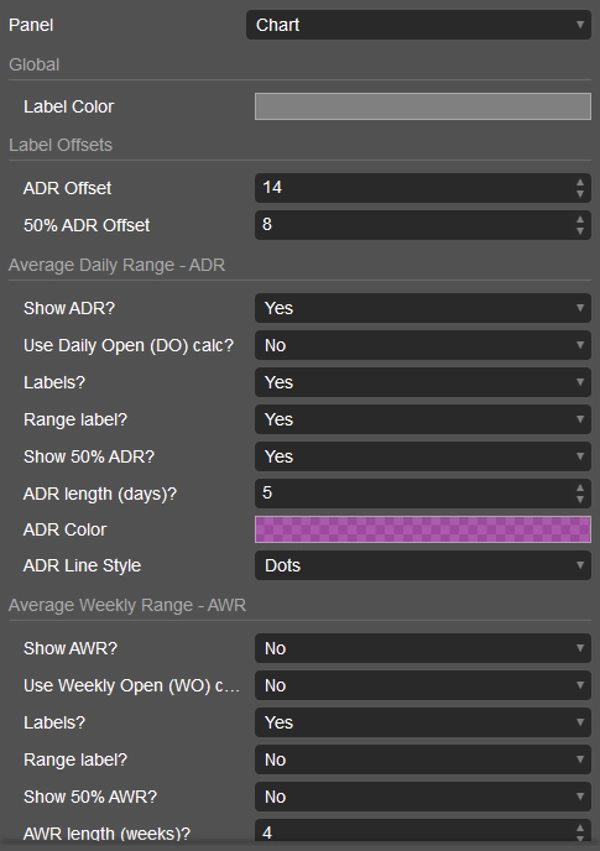
- Configuraciones Globales: Colores de etiquetas, Desplazamientos.
- Rango Diario Promedio (ADR): Activar/Desactivar, Usar Apertura Diaria, Mostrar Etiquetas, Mostrar Rango, Mostrar Nivel 50%, Periodo de Retroceso, Color, Estilo de Línea.
- Rango Semanal Promedio (AWR): Configuraciones totalmente personalizables, igual que ADR.
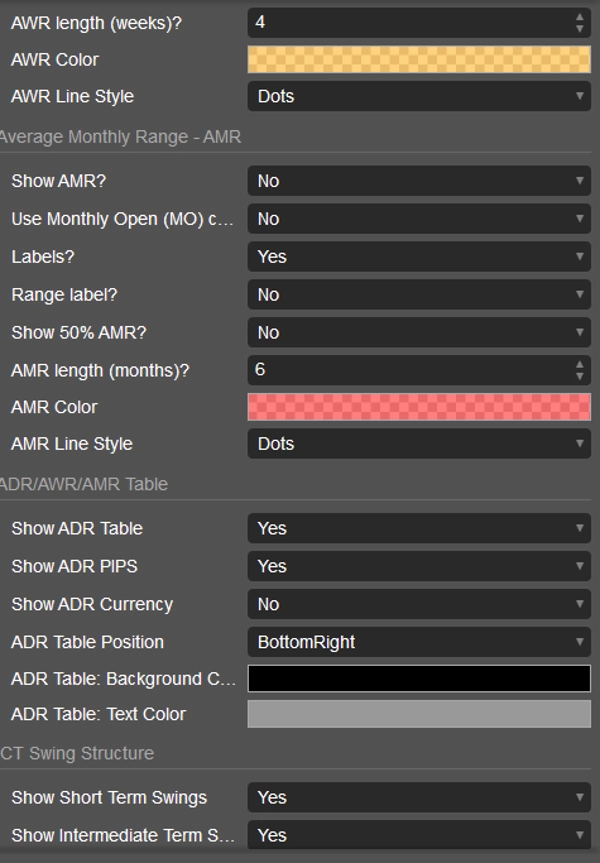
- Rango Mensual Promedio (AMR): Configuraciones totalmente personalizables, igual que ADR.
- Tabla de Datos: Activar/Desactivar, Mostrar Pips, Mostrar Moneda, Posición en Pantalla, Colores.
- Estructura de Mercado ICT: Activar ST, IT y LT swings de forma independiente.
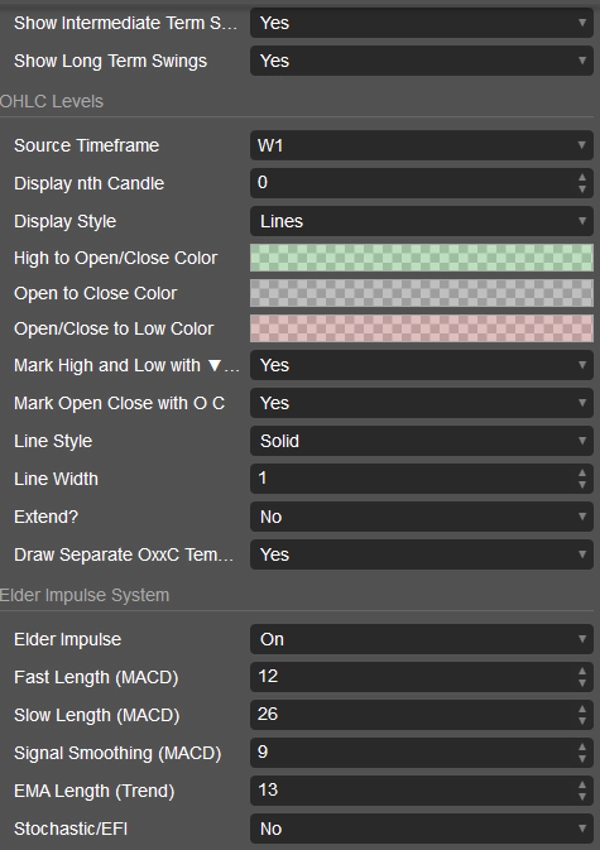
- Niveles OHLC: Marco temporal fuente, Retroceso de vela, Estilo de visualización (Líneas/Cajas), Todos los colores, Marcar máximos/mínimos, Marcar apertura/cierre, Extender líneas, Mostrar plantilla.
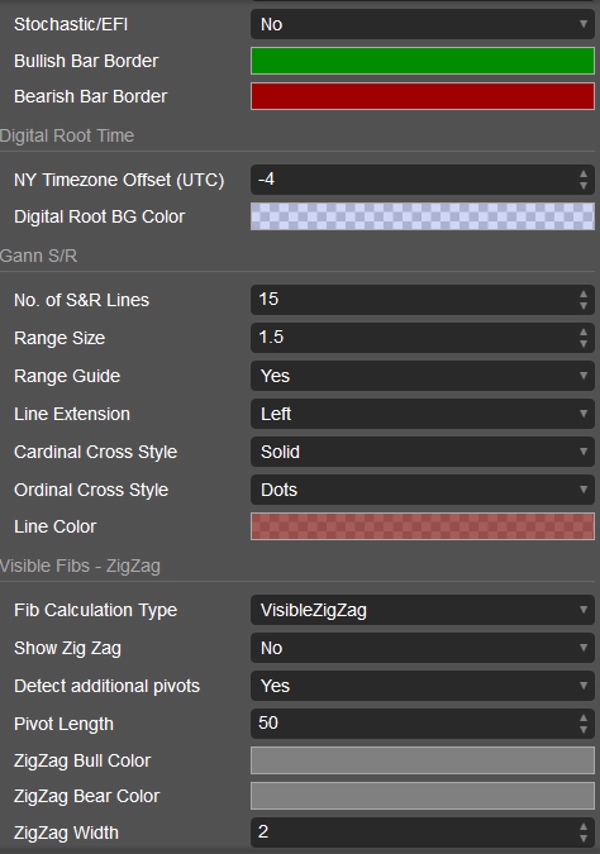
- Elder Impulse System: Activar/Desactivar, Todos los parámetros MACD y EMA, Modo Estocástico/EFI, Colores de borde de barra alcista/bajista.
- Tiempo de Raíz Digital: Desplazamiento de zona horaria NY, Color de fondo.
- Gann S/R: Número de líneas, Tamaño del rango, Extensión de línea, Estilos de línea, Color.
- Fibs Visibles: Tipo de cálculo (ZigZag/Rango de gráfico), Mostrar ZigZag (desactivado por defecto), Todos los parámetros ZigZag, Anclaje Estable y Reinicio de Ruptura, Todos los parámetros de nivel y línea, Relleno de fondo, Invertir, Escala logarítmica, Controles de etiqueta, y más de 25 niveles individuales de Fibonacci que pueden activarse, personalizarse y recolorearse.
Eleva tu trading con el conjunto definitivo de herramientas de acción del precio. Deja de dibujar líneas y comienza a ver las configuraciones. ¡Obtén hoy la ADVANCED ICT SUITE PRO de LudwigICT! 🚀🚀🚀
Si tienes alguna pregunta o encuentras algún problema, no dudes en contactarme. ¡Estoy feliz de ayudarte!
Descargo de responsabilidad:
Al usar mis algoritmos, reconoces que el trading implica riesgos inherentes y que el rendimiento pasado no garantiza resultados futuros. Es esencial que tengas una estrategia sólida de gestión de riesgos y, sobre todo, que mantengas la disciplina en adherirte a los niveles de stop-loss. No gestionar el riesgo adecuadamente puede llevar a pérdidas significativas. No soy responsable de ningún resultado financiero derivado del uso de estos algoritmos. Opera con responsabilidad y siempre sigue las prácticas adecuadas de gestión de riesgos.
¡Bendiciones! 🙌
Resumen
Valoraciones de clientes
5 | 50 % | |
4 | 50 % | |
3 | 0 % | |
2 | 0 % | |
1 | 0 % |


