
Descripción
⚠️ Nos mudamos a 👉 PrimeQuant
🚫🚫🚫 ¡No compres este indicador!
⚡ VERSIÓN DE PRÓXIMA GENERACIÓN DISPONIBLE: Esta herramienta clásica de LudwigICT ha sido rediseñada, reestructurada y relanzada bajo nuestra nueva marca de desarrollador, PrimeQuant. La nueva versión presenta una interfaz simplificada y propiedades actualizadas para las condiciones actuales del mercado. Obtén la versión mejorada a un precio con descuento aquí:
👉 Liquidity Sweep True Channel
👉 Liquidity Sweep True Channel
👉 Liquidity Sweep True Channel
(Por favor, tenga en cuenta: la lista de LudwigICT sigue activa para usuarios antiguos pero ya no recibirá actualizaciones ni descuentos activos.)
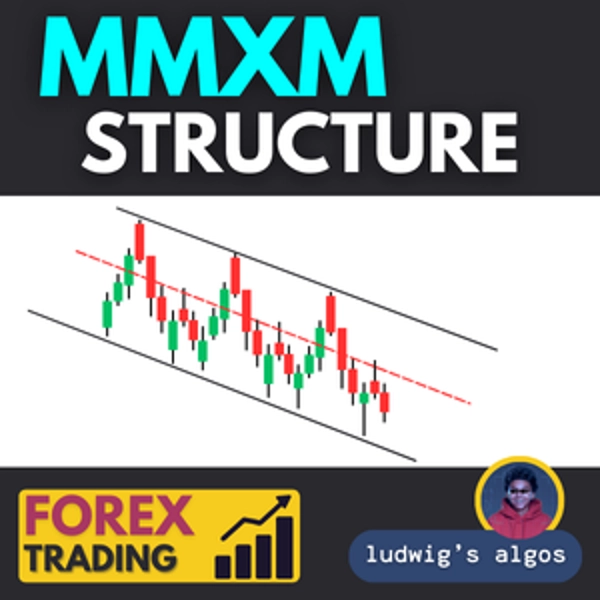
Esta Estructura MMXM es esencialmente una herramienta de mapeo de oscilaciones de estructura de mercado que los traders pueden usar para identificar configuraciones de venta (o configuraciones de compra) basadas en máximos/mínimos de oscilación y extremos de precio.
La Estructura MMXM es una herramienta avanzada de análisis de acción del precio diseñada para mapear la estructura del mercado y resaltar oportunidades potenciales de trading con precisión.
Este indicador detecta y marca automáticamente máximos de oscilación y mínimos de oscilación durante un período configurable de retroceso, conectándolos con un marco ZigZag para hacer la dirección del mercado y los cambios estructurales inmediatamente visibles.
Para configuraciones de venta, el indicador enfatiza extremidades superiores del mercado donde el precio ha alcanzado puntos significativos de resistencia o agotamiento. Estos se muestran en rojo, sirviendo como niveles de referencia potenciales para entradas cortas. La herramienta también proyecta líneas extremas del envolvente del cuerpo, mostrando el alcance máximo y mínimo del cuerpo de la vela dentro de una oscilación, permitiendo a los traders evaluar si el precio está sobreextendido antes de una reversión.
Características clave:
- Detección automática de oscilaciones: Identifica y marca máximos y mínimos pivote sin artefactos de repintado retardado.
- Visualización de estructura ZigZag: Conecta puntos pivote para facilitar la lectura del flujo de tendencia y rupturas estructurales.
- Marcadores de extremidades superiores (enfoque en venta): Destaca máximos significativos que pueden servir como zonas de oferta o resistencia.
- Extremidades del envolvente del cuerpo: Traza líneas de referencia punteadas arriba y abajo de las oscilaciones para medir la extensión del precio.
- Proyección de línea de extensión: Opcionalmente extiende la última línea de oscilación hasta la barra actual para seguimiento en vivo del precio.
- Opción de etiquetado: Muestra niveles exactos de precio en puntos de oscilación para una orientación precisa.
- Apariencia personalizable: Colores, longitudes y opciones de visualización ajustables para estilos de trading individuales.
Cómo usar para vender o comprar:
- Espera a que se forme un marcador de extremidad superior (rojo) en un máximo o mínimo significativo.
- Confirma la posible reversión con confluencia adicional (por ejemplo, vela de rechazo, divergencia o nivel clave).
- Usa la extremidad y la línea de tendencia ZigZag como referencia de resistencia.
- Entra en posiciones cortas o largas con stops por encima del último máximo o mínimo de oscilación y objetivos establecidos cerca del siguiente mínimo o máximo de oscilación o ruptura estructural.
Si tienes alguna pregunta o encuentras algún problema, no dudes en contactarme. ¡Estoy feliz de ayudarte!
Descargo de responsabilidad:
Al usar mis algoritmos, reconoces que el trading implica riesgos inherentes y que el rendimiento pasado no garantiza resultados futuros. Es esencial que tengas una estrategia sólida de gestión de riesgos y, sobre todo, que mantengas la disciplina para adherirte a los niveles de stop-loss. No gestionar adecuadamente el riesgo puede llevar a pérdidas significativas. No soy responsable de ningún resultado financiero derivado del uso de estos algoritmos. Opera con responsabilidad y siempre sigue prácticas adecuadas de gestión de riesgos.
¡Bendiciones! 🙌
Resumen
Valoraciones de clientes
5 | 33 % | |
4 | 67 % | |
3 | 0 % | |
2 | 0 % | |
1 | 0 % |


