
Açıklama
⚠️ Taşındık 👉 PrimeQuant
🚫🚫🚫 Bu göstergeleri satın almayın!
⚡ GELECEK NESİL SÜRÜM MEVCUT: Bu klasik LudwigICT aracı yeniden tasarlandı, yapılandırıldı ve yeni geliştirici markamız altında tekrar yayınlandı, PrimeQuant. Yeni sürüm, güncel piyasa koşulları için sadeleştirilmiş bir kullanıcı arayüzü ve güncellenmiş özellikler sunar. İyileştirilmiş sürümü indirimli fiyata buradan edinin:
👉 Complete ICT SMC Suite - ADR AWR AMR OHLC Fibs EIS SR Alert
👉 Complete ICT SMC Suite - ADR AWR AMR OHLC Fibs EIS SR Alert
👉 Complete ICT SMC Suite - ADR AWR AMR OHLC Fibs EIS SR Alert
(Lütfen not edin: LudwigICT listesi eski kullanıcılar için aktif kalmaya devam edecek ancak artık güncelleme veya aktif fiyat indirimleri almayacaktır.)
🔥 GELİŞMİŞ ICT + ADR + AWR SUITE PRO
Tahmin etmeyi bırakın ve piyasayı kurumsal netlikle görmeye başlayın. LudwigICT tarafından geliştirilen GELİŞMİŞ ICT SUITE PRO, seçkin fiyat hareketi tüccarları için tasarlanmış profesyonel düzeyde, hepsi bir arada bir grafik araç setidir. Efsanevi Pine Script göstergesinin kararlı ve görsel olarak kusursuz bir kopyası olacak şekilde titizlikle tasarlanmış bu suite, kritik piyasa yapılarının karmaşık çizimini otomatikleştirir ve sizi gerçekten önemli olan şeye odaklanmaya bırakır: stratejiniz ve uygulamanız.
Bu sadece başka bir gösterge değil; piyasayı görmenin eksiksiz bir çerçevesidir. Fiyat, Zaman, Volatilite ve Momentum gibi temel ICT kavramlarını sorunsuzca entegre ederek, bu suite finansal piyasaların benzersiz, kurumsal düzeyde bir görünümünü doğrudan cTrader grafiğinizde sunar.
Neden LudwigICT Suite'i Seçmelisiniz?
- Hepsi Bir Arada Güç Merkezi: Bu tek gösterge onlarca ayrı aracı değiştirir. Fibonacci analizi, aralık projeksiyonları, çok katmanlı piyasa yapısı, daha yüksek zaman dilimi bağlamı ve momentum renklendirmesini hafif ve verimli bir pakette elde edersiniz.
- Sarsılmaz Kararlılık Kraldır: Kaydırırken seviyelerin zıpladığı ve yeniden çizildiği bir gösterge kullandınız mı? Biz bunu çözdük. Özel Akıllı Sabitleme mantığımız, Fibonacci seviyelerinizin önemli tarihi dönüm noktalarına kilitlenmesini sağlar ve sadece piyasa yapısı gerçekten değiştiğinde uyum sağlar.
- Görsel Mükemmellik ve Netlik: Bir tüccarın en değerli varlığının odağı olduğuna inanıyoruz. Bu suite netliği artırmak için tasarlanmıştır, karmaşa yaratmak için değil. Elemanlar temiz, müdahale etmeyen ve tamamen özelleştirilebilir. Varsayılan ayarlar kutudan çıkar çıkmaz profesyonel kullanım için hazırdır.
- Ciddi Tüccarlar İçin Hassas Mühendislik: Elder Impulse System'den Ortalama Günlük Aralığa kadar her hesaplama, orijinal, güvenilir Pine Script mantığı ile 1:1 uyumlu olacak şekilde titizlikle test edilmiştir. Kestirme yok, yaklaşık hesaplama yok.
Ana Özellikler Açıklaması
Suite, tam olarak ticaret tarzınıza uyacak şekilde açıp kapatabileceğiniz ve özelleştirebileceğiniz birkaç güçlü, bağımsız modülden oluşur.
✔️ Kararlı ve Sabitlenmiş Fibonacci Düzeltmesi (Suite'in Kalbi)
cTrader'da bulunan en kararlı ve akıllı Fibonacci aracı.
- Akıllı Sabitleme Mantığı: Son büyük, önemli salınım yüksek ve düşüklerini otomatik olarak tanımlar ve kilitler, analiziniz için kararlı ve güvenilir bir fiyat aralığı sağlar.
- Akıllı Kırılma Sıfırlaması: Fibonacci seviyeleri, fiyat belirlenen aralığın ötesinde kararlı bir kapanış yapana kadar sabit kalır (kırılma mesafesi tamamen özelleştirilebilir). Bu, çizimin küçük geri çekilmelerde zıplamasını engeller ve sadece piyasa yapısı gerçekten değiştiğinde uyum sağlar.
- İmza Kesikli Trend Çizgisi: İkonik kesikli çapraz çizgi, Fibonacci aralığınızın sabitleme noktalarını bağlar ve analiz ettiğiniz trendin net görsel temsilini sağlar.
- İsteğe Bağlı ZigZag Kaplaması: Ek onay için, tüm tarihsel dönüm noktalarının yolunu görmek üzere klasik bir ZigZag kaplamasını etkinleştirebilirsiniz. Bu, temiz bir grafik için varsayılan olarak devre dışıdır.
✔️ Elder Impulse Sistemi (Momentum Çubuğu Renklendirmesi)
Piyasanın üçlü fikir birliğini anında değerlendirin: trend, momentum ve güç.
- Yeşil Çubuklar: Boğa fikir birliğini gösterir (13 EMA yükseliyor ve MACD Histogramı yükseliyor). Piyasa güçlü bir yükseliş trendinde.
- Kırmızı Çubuklar: Ayı fikir birliğini gösterir (13 EMA düşüyor ve MACD Histogramı düşüyor). Piyasa güçlü bir düşüş trendinde.
- Mavi Çubuklar: Nötr durumu veya trend ile momentum arasındaki anlaşmazlığı gösterir. Dikkat zamanı.
- Çubuk Sınırları: İnce ama kritik bir özellik. Her çubuğun gerçek yönünü (boğa veya ayı kapanışı) göstermek için renkli bir sınır çizilir; bu, ana renk geçersiz kılındığında doğru mum çubuğu analiz için esastır.
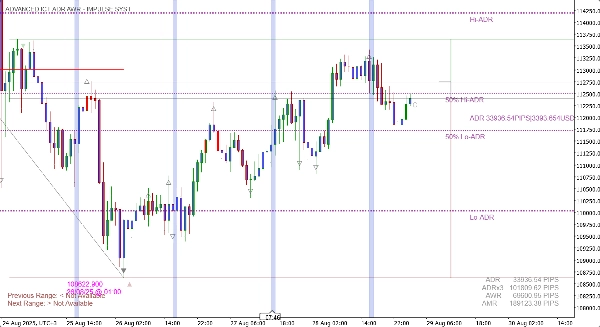
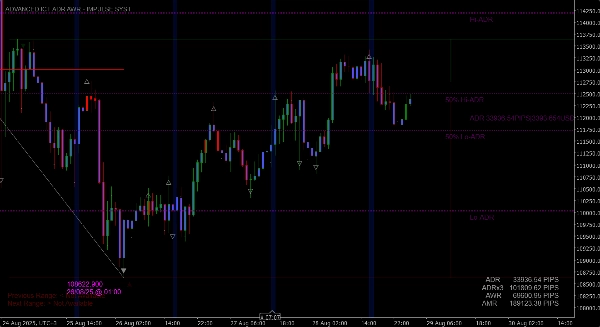
✔️ Gelişmiş Aralık Projeksiyonları (ADR, AWR, AMR)
Enstrümanınızın sınırlarını bilin ve gerçekçi günlük, haftalık ve aylık hedefler belirleyin.
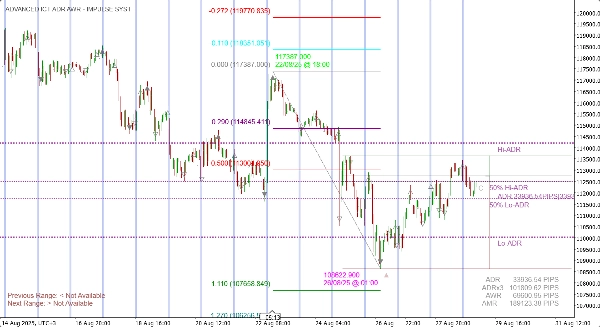
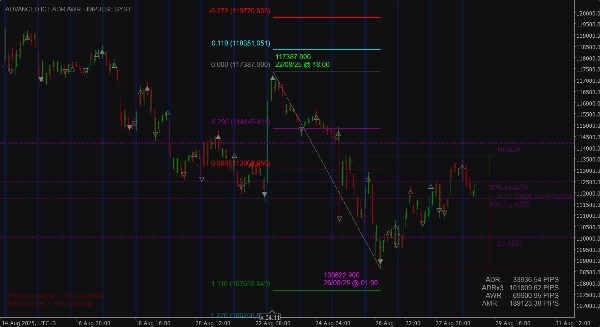
- Dinamik Projeksiyonlar: Ortalama Günlük Aralık, Ortalama Haftalık Aralık ve Ortalama Aylık Aralığı otomatik olarak hesaplar ve çizer.
- Projeksiyonlu Yüksek ve Düşükler: Hesaplanan aralıklara dayalı destek ve direnç seviyelerini görün.
- %50 Orta Noktalar: Projeksiyonlu aralık içinde denge ve potansiyel dönüş noktalarını belirlemek için kritik.
- Ekran Üzerinde Veri Tablosu: Tüm ana aralık değerlerini Pip ve/veya para birimi cinsinden hızlıca referans için temiz, özelleştirilebilir bir tablo gösterir.
✔️ Çok Katmanlı Piyasa Yapısı (ST, IT, LT Salınımlar)
Salınım noktalarını manuel çizmekten vazgeçin. Gösterge sizin için yapar.
- Otomatik Tanımlama: Kısa Vadeli (ST), Orta Vadeli (IT) ve Uzun Vadeli (LT) salınım yüksek ve düşüklerini doğrudan grafiğinizde çizer.
- Net Semboller: Piyasa yapısının hiyerarşisini temsil etmek için basit ve sezgisel bir nokta ve üçgen sistemi kullanır.
✔️ Daha Yüksek Zaman Dilimi OHLC Seviyeleri
Grafiğinizi hiç terk etmeden çok zaman dilimli bağlamda işlem yapın.
- Ana Fiyat Seviyeleri: Herhangi bir daha yüksek zaman diliminden (örneğin Haftalık, Günlük) Açılış, Yüksek, Düşük ve Kapanışı temiz çizgiler veya gölgeli kutular olarak üst üste bindirin.
- Oturum Analizi: Mevcut fiyatın önceki günün veya haftanın ana seviyelerine göre nerede olduğunu anında görün.
✔️ Dinamik Destek ve Direnç Araçları
- Gann S/D Seviyeleri: Enstrümanın volatilitesine uyum sağlayan güçlü, matematiksel olarak türetilmiş destek ve direnç çizgileri seti.
- Dijital Kök Zaman: Pan ve yakınlaştırdıkça dinamik olarak yeniden boyutlanan tam yükseklikte dikey çubuklarla belirli, önceden tanımlanmış zaman pencerelerini vurgular, böylece her zaman görünür kalır.
GELİŞMİŞ ICT SUITE PRO Nasıl Kullanılır
Bu suite basit bir "al/sat" sinyal göstergesi değil, çok yönlü bir araç setidir. İşte ticaretinize entegre etmek için birkaç yol:
- Yüksek Olasılıklı Kesişim Ticareti:
-
- Fiyatın kararlı, sabitlenmiş bir trend içinde önemli bir Fibonacci Seviyesine (örneğin, 0.618 veya 0.786 seviyesi) geri çekilmesini bekleyin.
- Kesişim arayın: Bu Fib seviyesi bir Daha Yüksek Zaman Dilimi OHLC Seviyesi veya bir Gann S/D Çizgisi ile hizalanıyor mu?
- Giriş tetikleyiciniz için Elder Impulse Sistemini kullanın. İşlemi gerçekleştirmeden önce çubuğun renginin lehinize (örneğin, uzun giriş için mavi/kırmızıdan yeşile) değişmesini bekleyin.
- Kar hedeflerinizi bir sonraki Fib uzatma seviyesinde veya projeksiyonlu ADR/AWR Yüksek/Düşük seviyesinde belirleyin.
- Trend Onayı ve Momentum Girişleri:
-
- Piyasa yapısı salınım noktalarını kullanarak genel trendi belirleyin (örneğin, artan yüksekler ve artan düşükler serisi).
- Geri çekilme sırasında, Elder Impulse renginin maviye (nötr) dönmesini bekleyin.
- Renk trend yönünüze döner dönmez (yükseliş için yeşil, düşüş için kırmızı) işlemi başlatın.
- Aralık ve Oturum Tersine Dönüş Ticareti:
-
- Fiyatın önemli bir sınırına, örneğin projeksiyonlu ADR Yüksek veya Önceki Günün Yüksek Seviyesine yaklaştığını gözlemleyin.
- Tükenme işaretleri arayın, örneğin fiyatın seviyenin üzerinde kapanamaması ve Elder Impulse renginin maviye dönmesi veya zıt renge geçmesi.
- Tersine dönüş işlemi başlatın, hedef olarak %50 ADR seviyesini veya aralığın diğer tarafını belirleyin.
Özelleştirilebilir Parametrelerin Tam Listesi
(Bu bölüm müşterilere ürünün esnekliği konusunda güven verir)
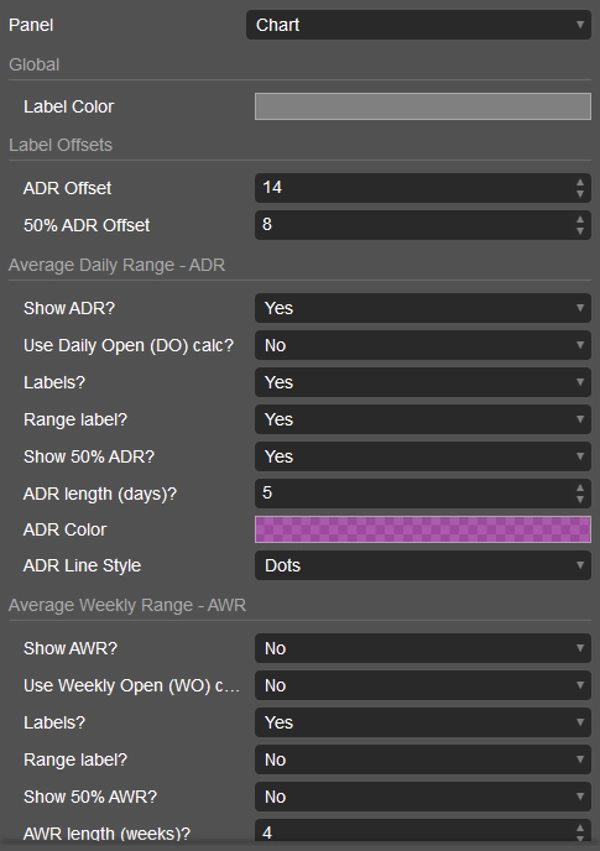
- Genel Ayarlar: Etiket Renkleri, Ofsetler.
- Ortalama Günlük Aralık (ADR): Açma/Kapama, Günlük Açılış Kullanımı, Etiketleri Göster, Aralığı Göster, %50 Seviyeyi Göster, Geriye Dönük Dönem, Renk, Çizgi Stili.
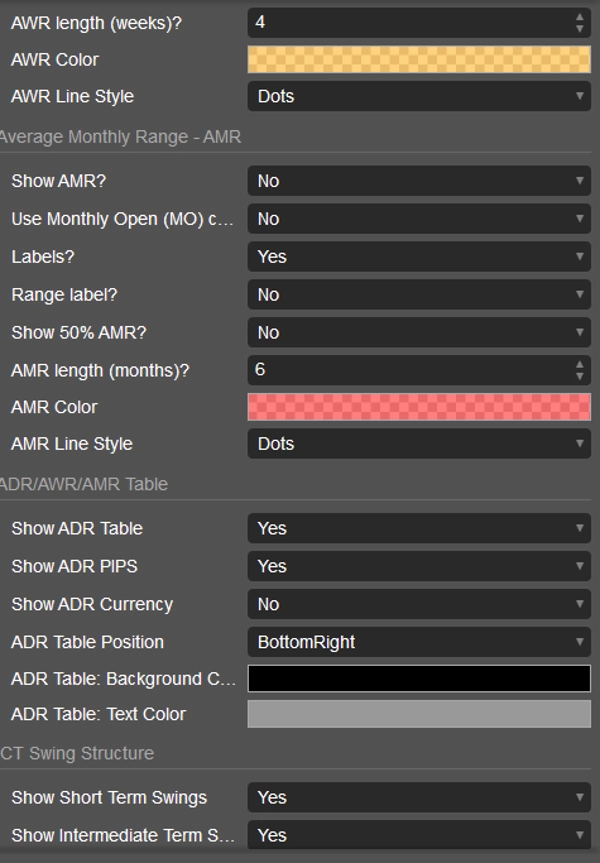
- Ortalama Haftalık Aralık (AWR): ADR ile aynı, tamamen özelleştirilebilir ayarlar.
- Ortalama Aylık Aralık (AMR): ADR ile aynı, tamamen özelleştirilebilir ayarlar.
- Veri Tablosu: Açma/Kapama, Pip Göster, Para Birimi Göster, Ekran Üstü Konum, Renkler.
- ICT Piyasa Yapısı: ST, IT ve LT salınımları bağımsız açma/kapama.
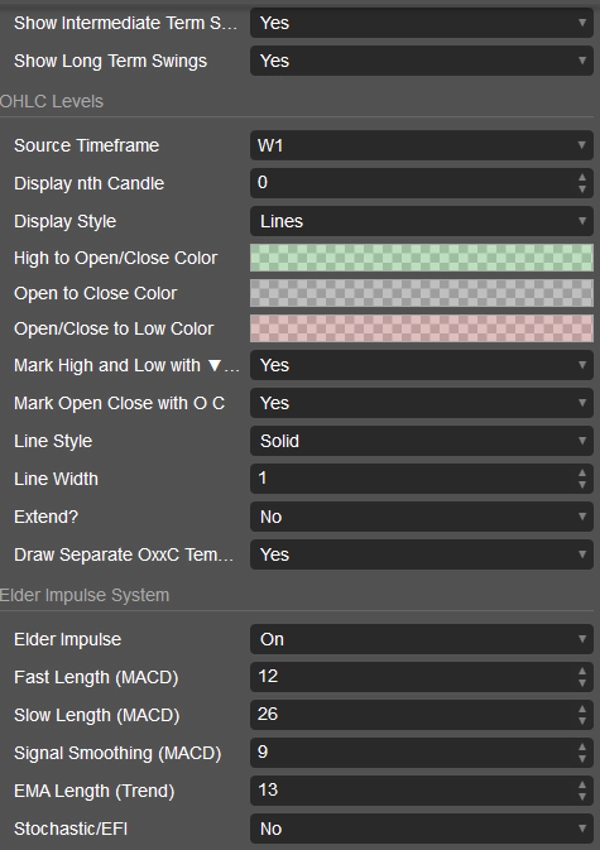
- OHLC Seviyeleri: Kaynak Zaman Dilimi, Mum Geriye Dönük, Görüntüleme Stili (Çizgiler/Kutular), Tüm Renkler, Yüksek/Düşük İşaretleme, Açılış/Kapanış İşaretleme, Çizgi Uzatma, Şablon Gösterimi.
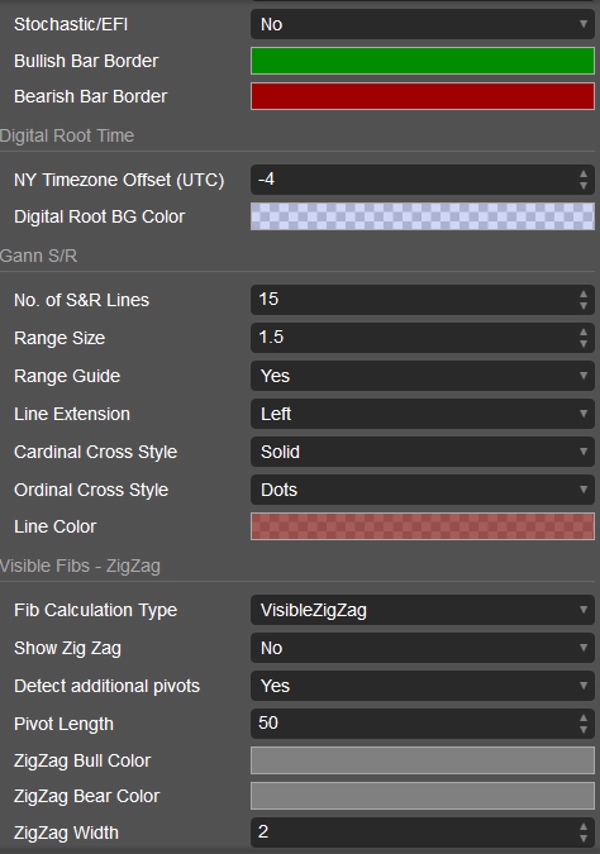
- Elder Impulse Sistemi: Açma/Kapama, Tüm MACD ve EMA Parametreleri, Stokastik/EFI Modu, Boğa/Ayı Çubuk Sınır Renkleri.
- Dijital Kök Zaman: NY Zaman Dilimi Ofseti, Arka Plan Rengi.
- Gann S/D: Çizgi Sayısı, Aralık Boyutu, Çizgi Uzatma, Çizgi Stilleri, Renk.
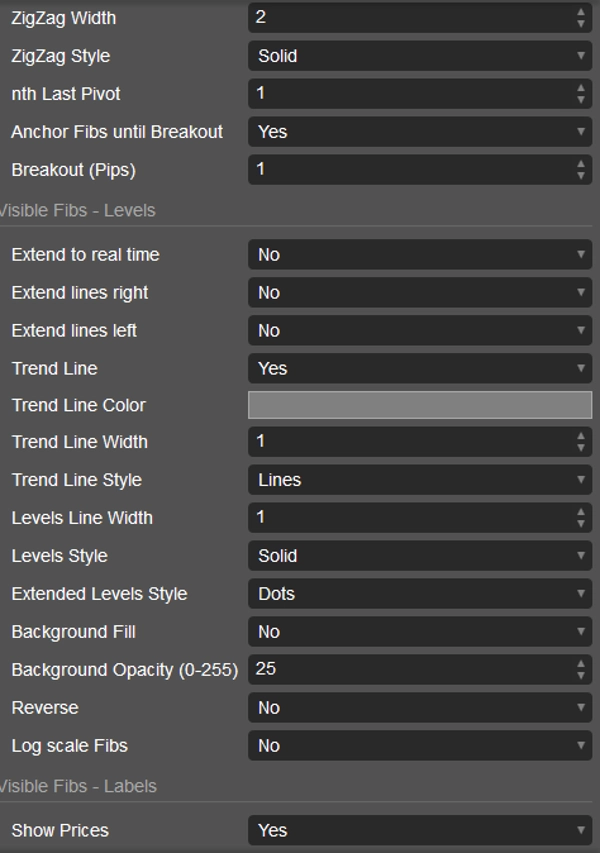
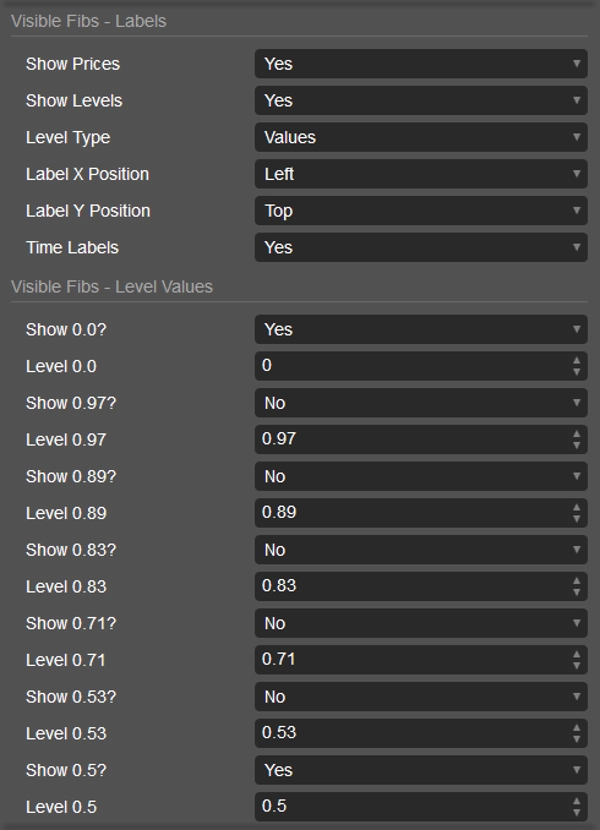
- Görünür Fibs: Hesaplama Türü (ZigZag/Grafik Aralığı), ZigZag Göster (varsayılan kapalı), Tüm ZigZag Parametreleri, Kararlı Sabitleme ve Kırılma Sıfırlaması, Tüm Seviye ve Çizgi Parametreleri, Arka Plan Dolgusu, Ters, Logaritmik Ölçek, Etiket Kontrolleri ve açılıp kapatılabilen, özelleştirilebilen ve yeniden renklendirilebilen 25'ten fazla bireysel Fibonacci seviyesi.
Ticaretinizi nihai fiyat hareketi araç seti ile yükseltin. Çizgi çizmeyi bırakın ve kurulumları görmeye başlayın. LudwigICT tarafından GELİŞMİŞ ICT SUITE PRO'yu bugün edinin! 🚀🚀🚀
Herhangi bir sorunuz veya sorun yaşamanız durumunda benimle iletişime geçmekten çekinmeyin. Size yardımcı olmaktan mutluluk duyarım!
Feragatname:
Algoritmalarımı kullanarak, ticaretin doğasında riskler olduğunu ve geçmiş performansın gelecekteki sonuçları garanti etmediğini kabul etmiş olursunuz. Sağlam bir risk yönetimi stratejisine sahip olmanız ve her şeyden önce stop-loss seviyelerine disiplinli bir şekilde uymanız çok önemlidir. Riskin doğru yönetilmemesi önemli kayıplara yol açabilir. Bu algoritmaların kullanımı sonucu oluşabilecek finansal sonuçlardan ben sorumlu değilim. Sorumlu bir şekilde işlem yapın ve her zaman uygun risk yönetimi uygulamalarını takip edin.
Hayırlı işler! 🙌
Özet
Müşteri değerlendirmeleri
5 | 50 % | |
4 | 50 % | |
3 | 0 % | |
2 | 0 % | |
1 | 0 % |


