
Açıklama
⚠️ Taşındık 👉 PrimeQuant
🚫🚫🚫 Bu göstergeleri satın almayın!
⚡ GELECEK NESİL SÜRÜM MEVCUT: Bu klasik LudwigICT aracı, yeni geliştirici markamız altında yeniden tasarlandı, yapılandırıldı ve yeniden yayınlandı, PrimeQuant. Yeni sürüm, güncel piyasa koşulları için sadeleştirilmiş bir kullanıcı arayüzü ve güncellenmiş özellikler sunar. İyileştirilmiş sürümü indirimli fiyatla buradan edinin:
👉 Liquidity Sweep True Channel
👉 Liquidity Sweep True Channel
👉 Liquidity Sweep True Channel
(Lütfen dikkat: LudwigICT listesi, eski kullanıcılar için aktif kalmaya devam edecek ancak artık güncelleme veya aktif fiyat indirimleri almayacaktır.)
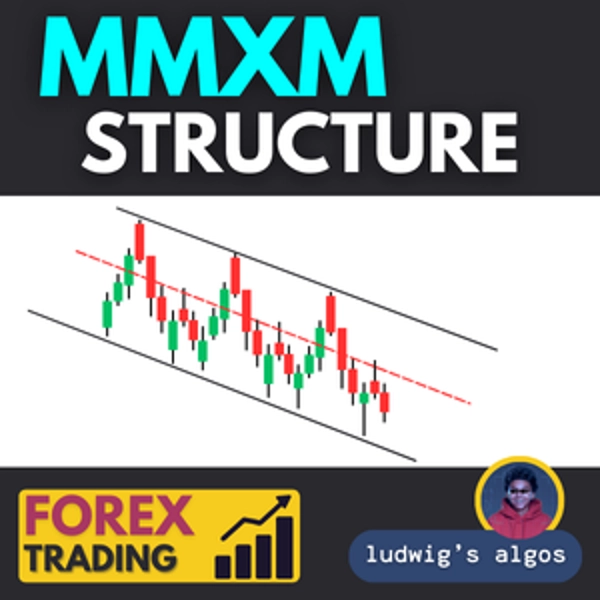
Bu MMXM Yapısı temelde bir piyasa yapısı salınım haritalama aracıdır ve traderların salınım yüksekleri/düşükleri ve fiyat uç noktalarına dayanarak satış düzenlerini (veya alış düzenlerini) tanımlamak için kullanabileceği bir araçtır.
MMXM Yapısı, piyasa yapısını haritalamak ve potansiyel ticaret fırsatlarını hassasiyetle vurgulamak için tasarlanmış gelişmiş bir fiyat hareketi analiz aracıdır.
Bu gösterge, yapılandırılabilir bir geriye dönük dönem boyunca salınım yükseklerini ve salınım düşüklerini otomatik olarak algılar ve işaretler, bunları ZigZag çerçevesi ile birleştirerek piyasa yönünü ve yapısal değişiklikleri hemen görünür kılar.
Satış tarafı düzenleri için, gösterge fiyatın önemli direnç veya tükenme noktalarına ulaştığı piyasanın üst uç noktalarını vurgular. Bunlar kırmızı renkte gösterilir ve potansiyel kısa pozisyon giriş referans seviyeleri olarak hizmet eder. Araç ayrıca, bir salınım içindeki maksimum ve minimum mum gövdesi erişimini gösteren gövde zarfı uç çizgilerini projekte eder, böylece traderlar fiyatın dönüş öncesi aşırı uzayıp uzamadığını değerlendirebilir.
Temel Özellikler:
- Otomatik Salınım Tespiti: Gecikmesiz ve yeniden boyama yapmayan pivot yüksekleri ve düşüklerini tanımlar ve işaretler.
- ZigZag Yapı Görselleştirmesi: Pivot noktalarını bağlayarak trend akışını ve yapısal kırılmaları kolay okunur hale getirir.
- Üst Uç Nokta İşaretleyicileri (Satış Odaklı): Tedarik bölgeleri veya direnç olarak hizmet edebilecek önemli yüksekleri vurgular.
- Gövde Zarfı Uç Noktaları: Fiyat uzamasını ölçmek için salınımların üstünde ve altında noktalı referans çizgileri çizer.
- Uzatma Çizgisi Projeksiyonu: İsteğe bağlı olarak en son salınım çizgisini mevcut bara kadar uzatarak canlı fiyat takibi sağlar.
- Etiketleme Seçeneği: Salınım noktalarında kesin fiyat seviyelerini göstererek hassas hedefleme sağlar.
- Özelleştirilebilir Görünüm: Bireysel ticaret stilleri için ayarlanabilir renkler, uzunluklar ve görüntüleme seçenekleri.
Satış veya Alım İçin Nasıl Kullanılır:
- Önemli bir yüksek veya düşükte bir üst uç nokta işaretleyicisi (kırmızı) oluşmasını bekleyin.
- Ek uyumlarla (örneğin, reddetme mumu, uyumsuzluk veya önemli seviye) potansiyel dönüşü doğrulayın.
- Uç nokta ve ZigZag trend çizgisini direnç referansı olarak kullanın.
- Son salınım yüksek veya düşük seviyesinin üzerine stop koyarak kısa veya uzun pozisyonlara girin ve hedefleri bir sonraki salınım düşük veya yüksek ya da yapı kırılmasına yakın belirleyin.
Herhangi bir sorunuz veya sorun yaşamanız durumunda benimle iletişime geçmekten çekinmeyin. Size yardımcı olmaktan mutluluk duyarım!
Feragatname:
Algoritmalarımı kullanarak, ticaretin doğasında riskler olduğunu ve geçmiş performansın gelecekteki sonuçları garanti etmediğini kabul etmiş olursunuz. Sağlam bir risk yönetimi stratejisine sahip olmanız ve her şeyden önce stop-loss seviyelerine disiplinli bir şekilde uymanız çok önemlidir. Riskleri doğru yönetememek önemli kayıplara yol açabilir. Bu algoritmaların kullanımı sonucu oluşabilecek finansal sonuçlardan ben sorumlu değilim. Sorumlu bir şekilde ticaret yapın ve her zaman uygun risk yönetimi uygulamalarını takip edin.
Hayırlı işler! 🙌
Özet
Müşteri değerlendirmeleri
5 | 33 % | |
4 | 67 % | |
3 | 0 % | |
2 | 0 % | |
1 | 0 % |


