
Opis
⚠️ Przenieśliśmy się do 👉 PrimeQuant
🚫🚫🚫 Nie kupuj tego wskaźnika!
⚡ DOSTĘPNA WERSJA NOWEJ GENERACJI: Ten klasyczny narzędzie LudwigICT zostało przeprojektowane, zrestrukturyzowane i ponownie wydane pod naszą nową marką deweloperską, PrimeQuant. Nowa wersja oferuje uproszczony interfejs użytkownika i zaktualizowane właściwości dostosowane do obecnych warunków rynkowych. Uzyskaj ulepszoną wersję w cenie z rabatem dla użytkowników legacy tutaj:
👉 Elliott Waves Auto Detection + Fibonacci
👉 Elliott Waves Auto Detection + Fibonacci
👉 Elliott Waves Auto Detection + Fibonacci
(Proszę zauważyć: oferta LudwigICT pozostaje aktywna dla użytkowników legacy, ale nie będzie już otrzymywać aktualizacji ani aktywnych rabatów cenowych.)
📈 Elliott Wave – Poziomy Fibonacciego [LudwigICT]
🔥 Odblokuj pełną moc Teorii Fal Elliotta połączoną z dynamicznymi zniesieniami Fibonacciego – wszystko zautomatyzowane dla Ciebie w cTrader!
Ten wskaźnik dostarcza profesjonalne liczenie fal i precyzyjne strefy Fibonacciego bezpośrednio na Twoich wykresach, ułatwiając prognozowanie trendów i realizację transakcji bardziej niż kiedykolwiek.
✨ Kluczowe cechy
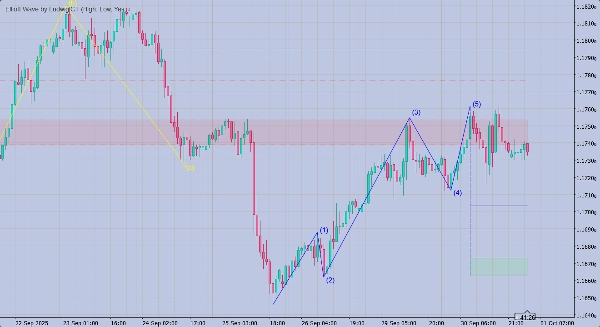
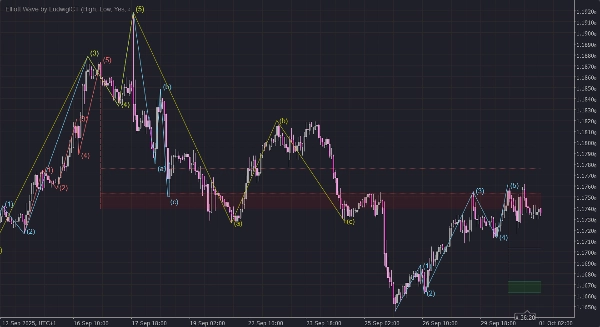
🔹 Automatyczne wykrywanie fal
- Identyfikuje 5-falowe struktury motywacyjne (1–5).
- Wykrywa 3-falowe wzory korekcyjne (A–B–C) natychmiast po zakończeniu fali motywacyjnej.
🔹 Dynamiczne zniesienia Fibonacciego
- Automatycznie rysuje kluczowe strefy zniesień: 0.500 • 0.618 • 0.764 • 0.854.
- Aktualizuje się w czasie rzeczywistym wraz z rozwojem fali.
- Podkreśla unieważnienia za pomocą linii przerywanych.
🔹 Wielokrotny framework ZigZag
- Uruchamia trzy niezależne obliczenia ZigZag z konfigurowalną długością i kolorami.
- Zapewnia elastyczną czułość dla różnych warunków rynkowych.
🔹 Profesjonalna wizualizacja
- Czyste etykiety fal
(1)…(5)oraz(a)(b)(c)umieszczone z inteligentnymi przesunięciami opartymi na ATR. - Pola wybicia z pogrubionymi markerami X, gdy poziomy zostaną przekroczone.
- Obszary wypełnienia Fibonacciego przypominające gradient dla łatwego zauważenia.
🔹 Wsparcie handlowe
- Automatyczna identyfikacja możliwej nowej fali (1) po korekcie A–B–C.
- Alerty dźwiękowe dla nowych fal, unieważnień i sygnałów wybicia.
🛠 Jak używać
- Zastosuj na wykresie
-
- Po prostu przeciągnij i upuść Elliott Wave – Fibonacci Levels [LudwigICT] na swój wykres cTrader.
- Działa na wszystkich interwałach czasowych (scalping, swing, długoterminowy).
- Dostosuj parametry
- Odczytaj fale
-
- ✅ Fale
(1–5)= fala motywacyjna (kierunek trendu). - 🔄 Fale
(a–b–c)= fala korekcyjna (przeciwny trend). - 📊 Poziomy Fibonacciego pokazują prawdopodobne strefy zniesień dla wejść/wyjść.
- ✅ Fale
- Handluj z pewnością
-
- Wchodź w transakcje wokół zniesień Fibonacciego po zakończonej fali motywacyjnej.
- Zarządzaj ryzykiem, gdy poziomy zostaną przełamane (wskaźnik automatycznie Cię o tym powiadomi).
- Szukaj ikony Następnej Fali (1), aby przewidzieć nowe cykle trendu.
🎯 Dlaczego warto wybrać ten wskaźnik?
✅ Oszczędza godziny ręcznego liczenia fal.
✅ Unika subiektywnych błędów w analizie fal Elliotta.
✅ Czysta, precyzyjna, profesjonalna wizualizacja bezpośrednio na wykresie.
✅ Stworzony i zoptymalizowany przez LudwigICT, zaufanego w automatyzacji handlu.
🖥 Kompatybilność
- Platforma: cTrader Desktop v5+
- Instrumenty: Działa na Forex, Akcje, Indeksy, Surowce, Kryptowaluty.
- Interwały czasowe: Od 1-minutowego scalpingu do cotygodniowej analizy swingowej.
⚡️ Zacznij już teraz
🚀 Dodaj Elliott Wave – Fibonacci Levels [LudwigICT] do swojego arsenału handlowego już dziś i podnieś analizę wykresów na wyższy poziom!
👉 Idealny dla traderów, którzy polegają na price action, strukturze i zniesieniach Fibonacciego, aby precyzyjnie wyznaczać momenty wejścia i wyjścia.
Jeśli masz jakiekolwiek pytania lub napotkasz problemy, śmiało skontaktuj się ze mną. Chętnie pomogę!
Zastrzeżenie:
Korzystając z moich algorytmów, przyjmujesz do wiadomości, że handel wiąże się z ryzykiem i że wyniki historyczne nie gwarantują przyszłych rezultatów. Niezbędne jest posiadanie solidnej strategii zarządzania ryzykiem i, co najważniejsze, dyscypliny w przestrzeganiu poziomów stop-loss. Nieprawidłowe zarządzanie ryzykiem może prowadzić do znacznych strat. Nie ponoszę odpowiedzialności za jakiekolwiek skutki finansowe wynikające z użycia tych algorytmów. Handluj odpowiedzialnie i zawsze stosuj właściwe praktyki zarządzania ryzykiem.
Błogosławieństwa! 🙌
Podsumowanie
Opinie klientów
5 | 100 % | |
4 | 0 % | |
3 | 0 % | |
2 | 0 % | |
1 | 0 % |


